Many ways to use it. Each one pays off.
Each page here is one way ploteer saves a planner time and gives the schedule study its evidence. More wait in the app.
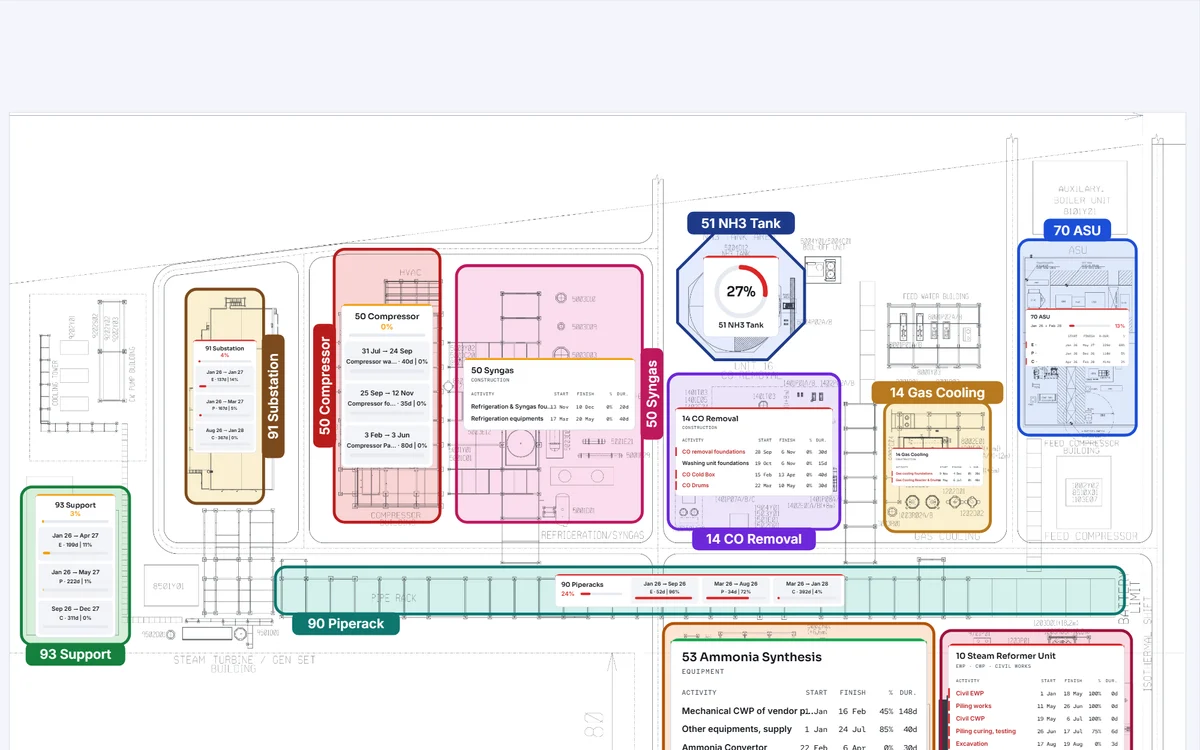 One page
The schedule on one page.
Visualize the project schedule. Put a large, complex schedule study on one page.
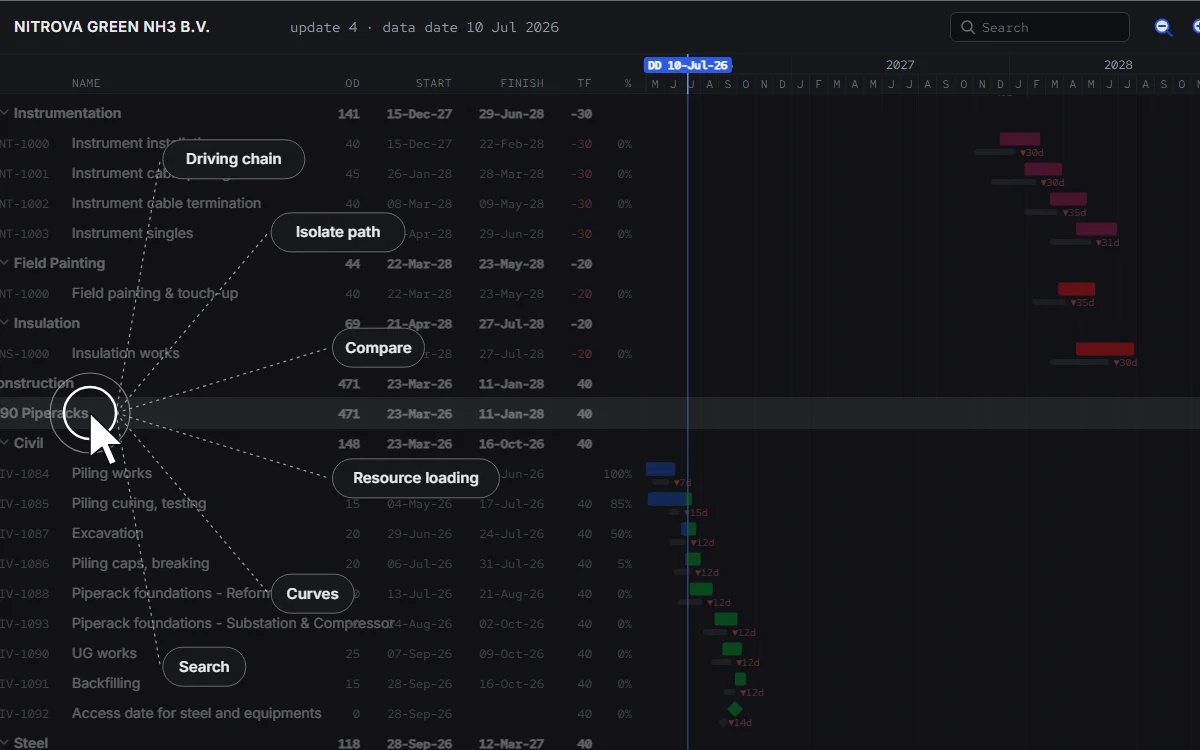 One click
Hours of effort in one click.
Compare, isolate the chain, draw the curves, read the delay notes. Each one is a click on the update you already have.
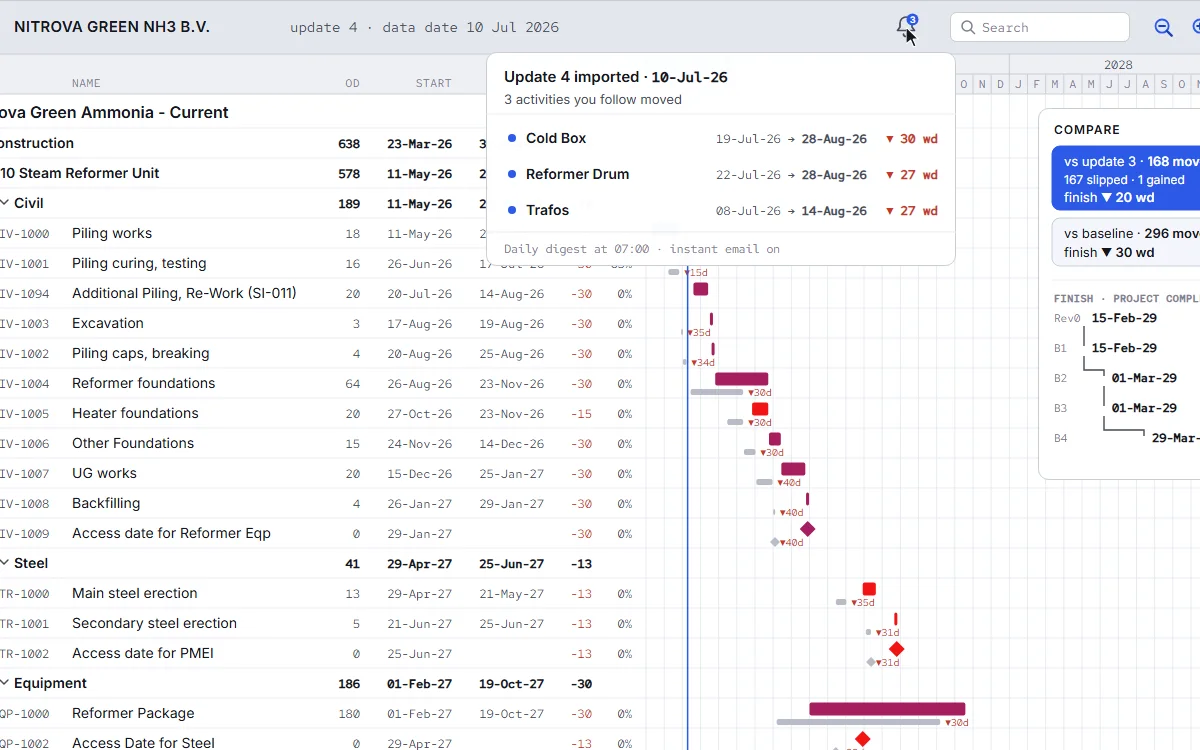 Responsive schedules
The schedule answers back.
Saved as “Live” or “Current”, every schedule is a snapshot. With ploteer, yours tells you the full story.
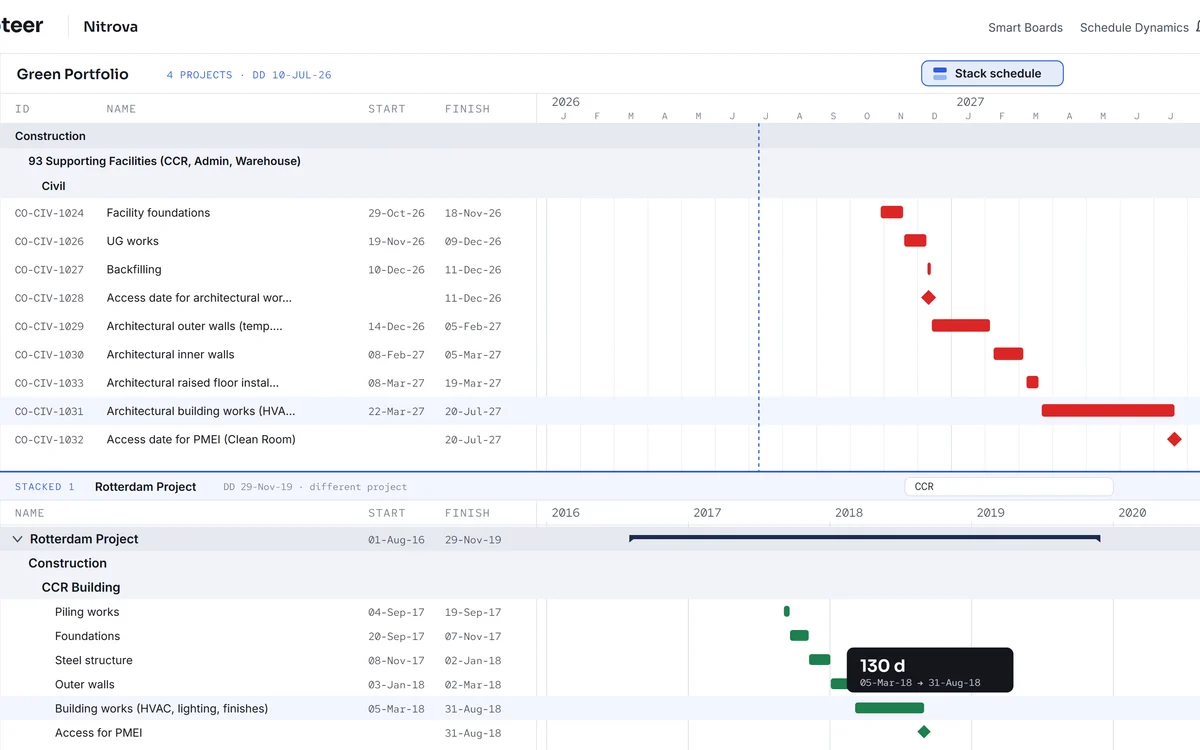 Many schedules
, reviewed as one.
Many projects, many submitters, many schedules. All on one screen, all reviewed at ploteer speed.
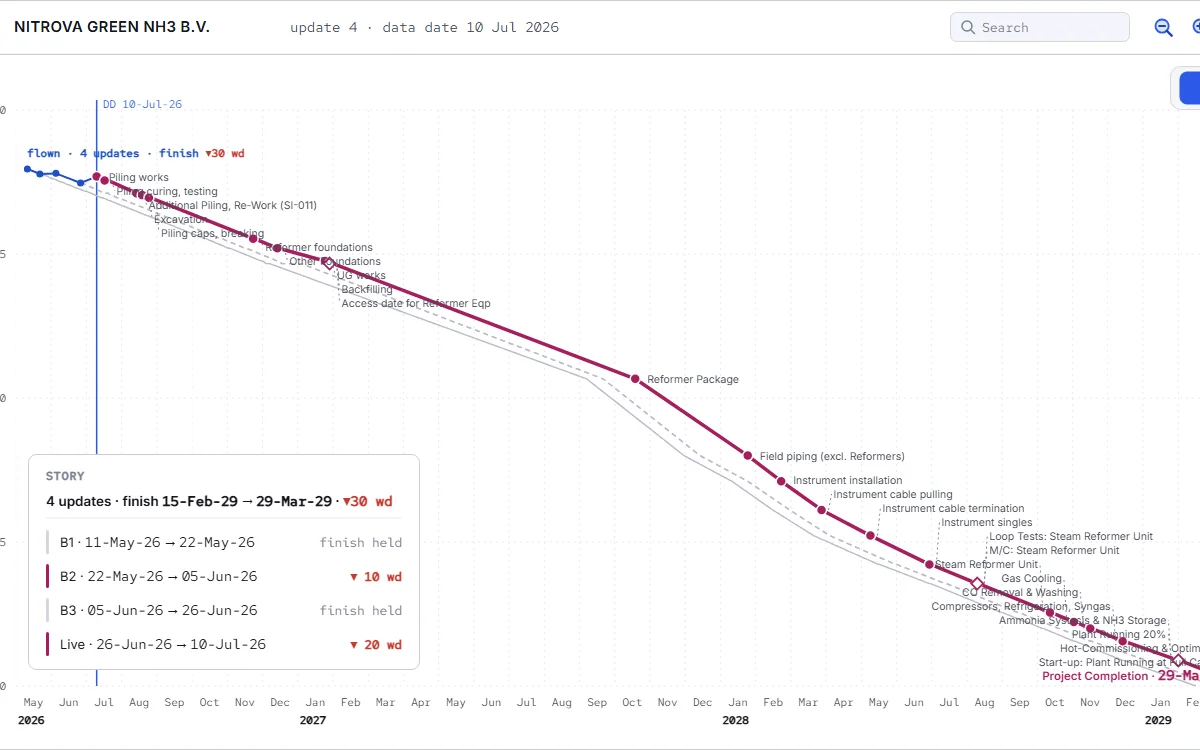 Drivers
Every date has a driver.
Pick any activity or milestone and get its driving chain right away. And of course the backbone that drives the whole project.
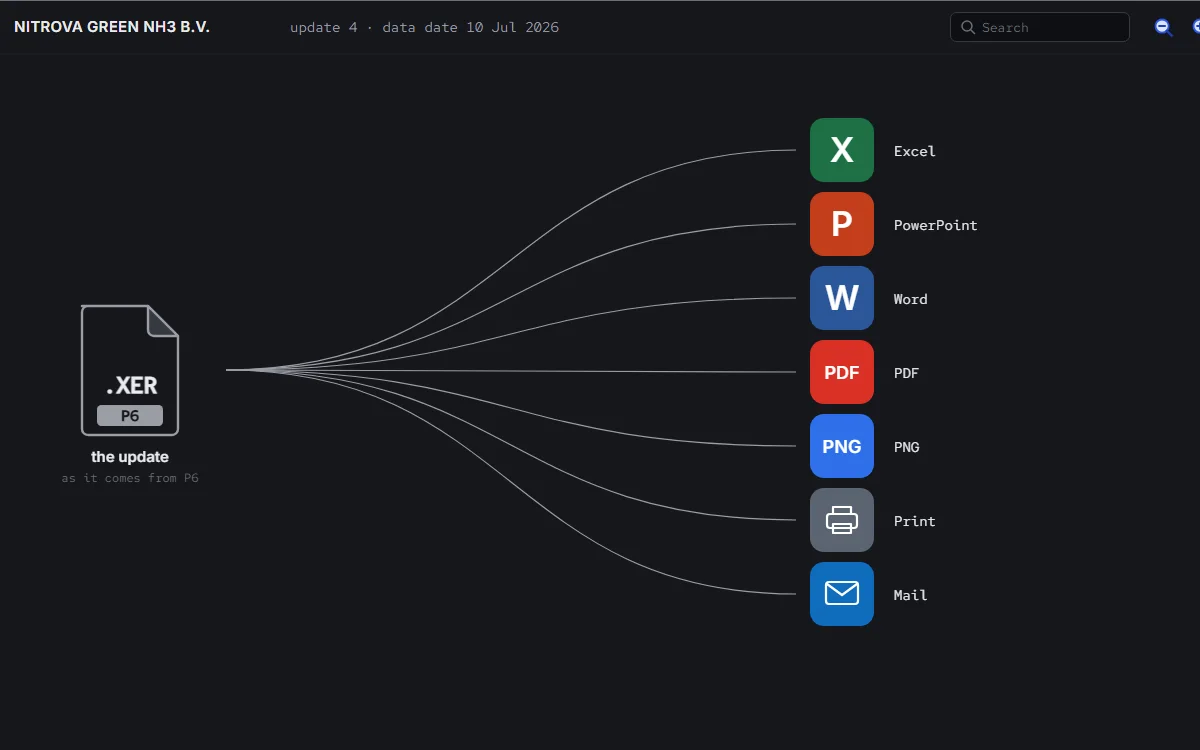 Outputs
Everything you see, board-ready.
One activity or the whole report, ready to present: as a picture, a table or a presentation file. In seconds.
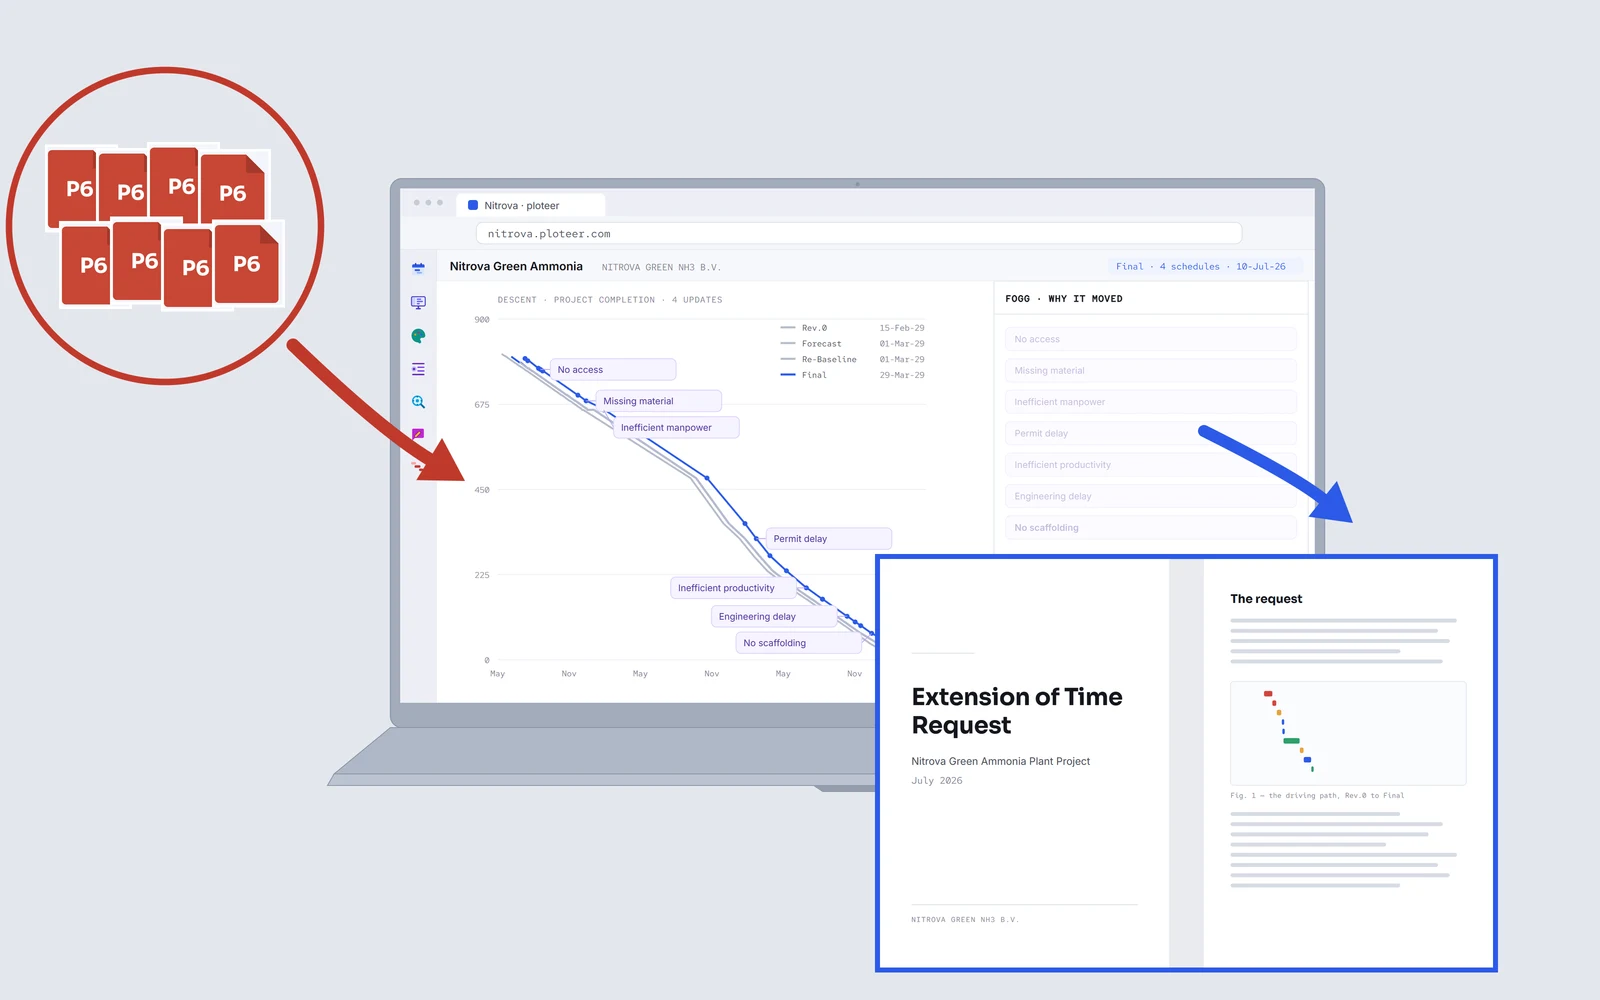 EOT
Extension of time (EOT): request it, review it or challenge it.
Give ploteer the updates, all at once or every time you update. It reads what happened, when, and by whom. Under FIDIC, NEC or the UAV.
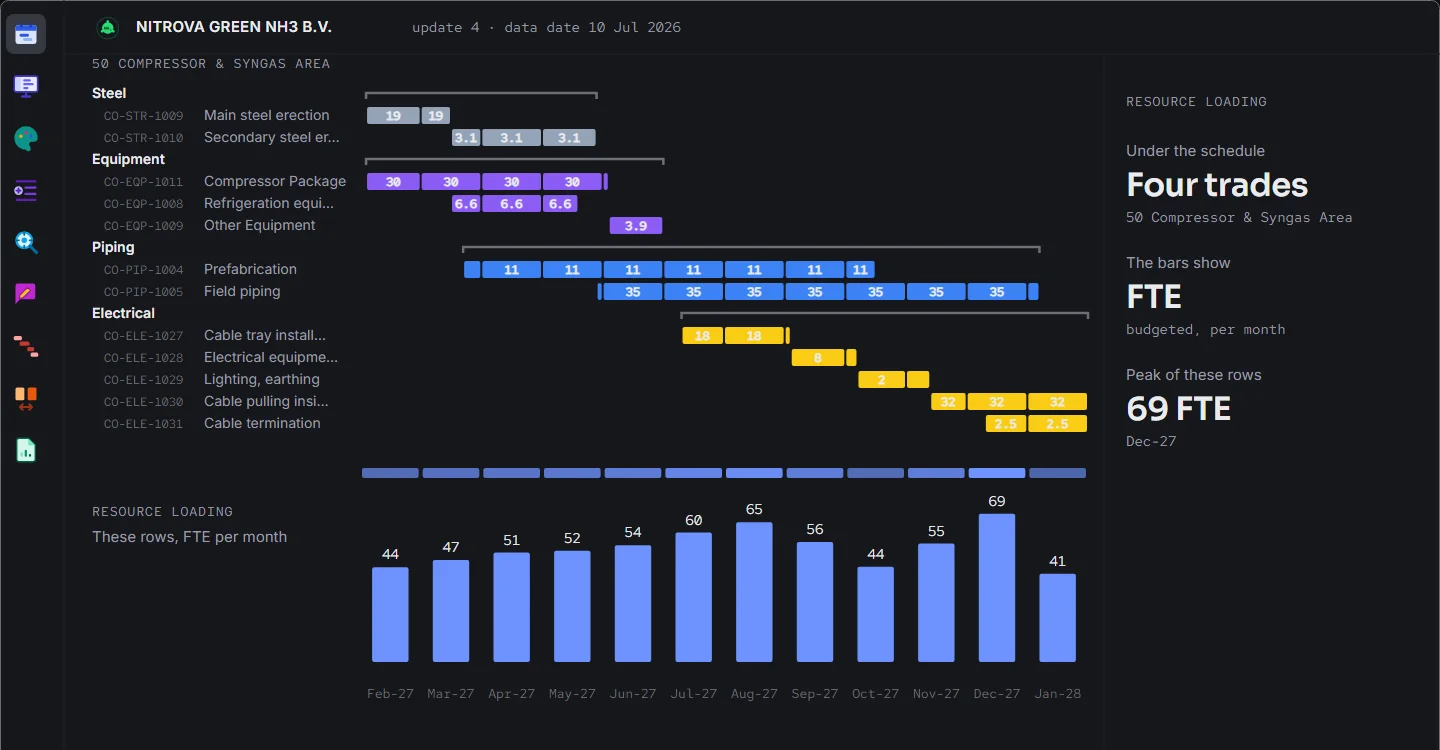 Resource review
The workload behind the schedule, before it reaches the site.
The workload under the schedule, read seven ways: the peaks, the critical load, the work pushed to the right. One click from the schedule.
 Advanced quality check
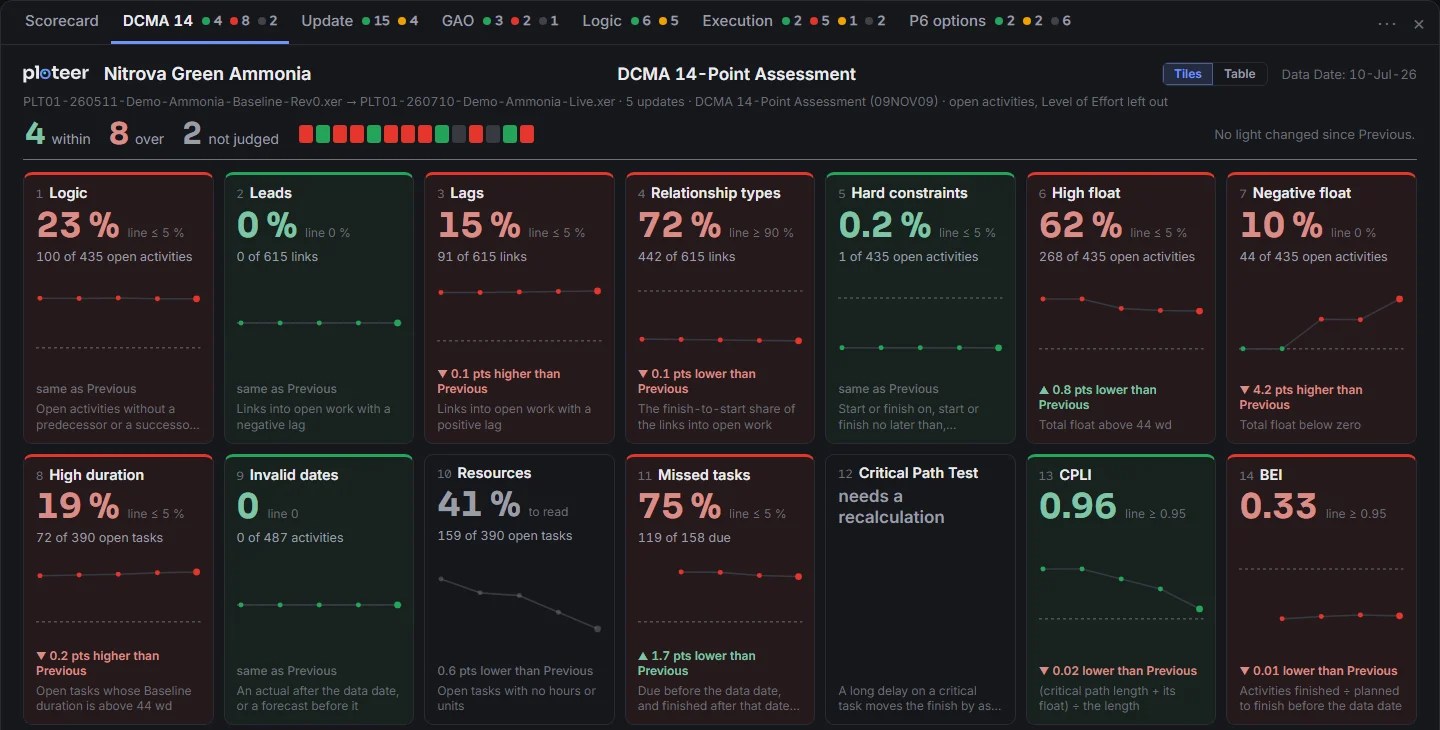
Every update, checked the moment it lands.
Seventy checks on every update, each against a named threshold, with the activities behind every count.