Everything you see, board-ready.
What a native schedule tells you is hard to present as it is. It takes the cycle of screenshot, spreadsheet and slide, many times over. In ploteer it comes out ready to present: a picture, a table or a presentation file. One activity or the whole report, in seconds.
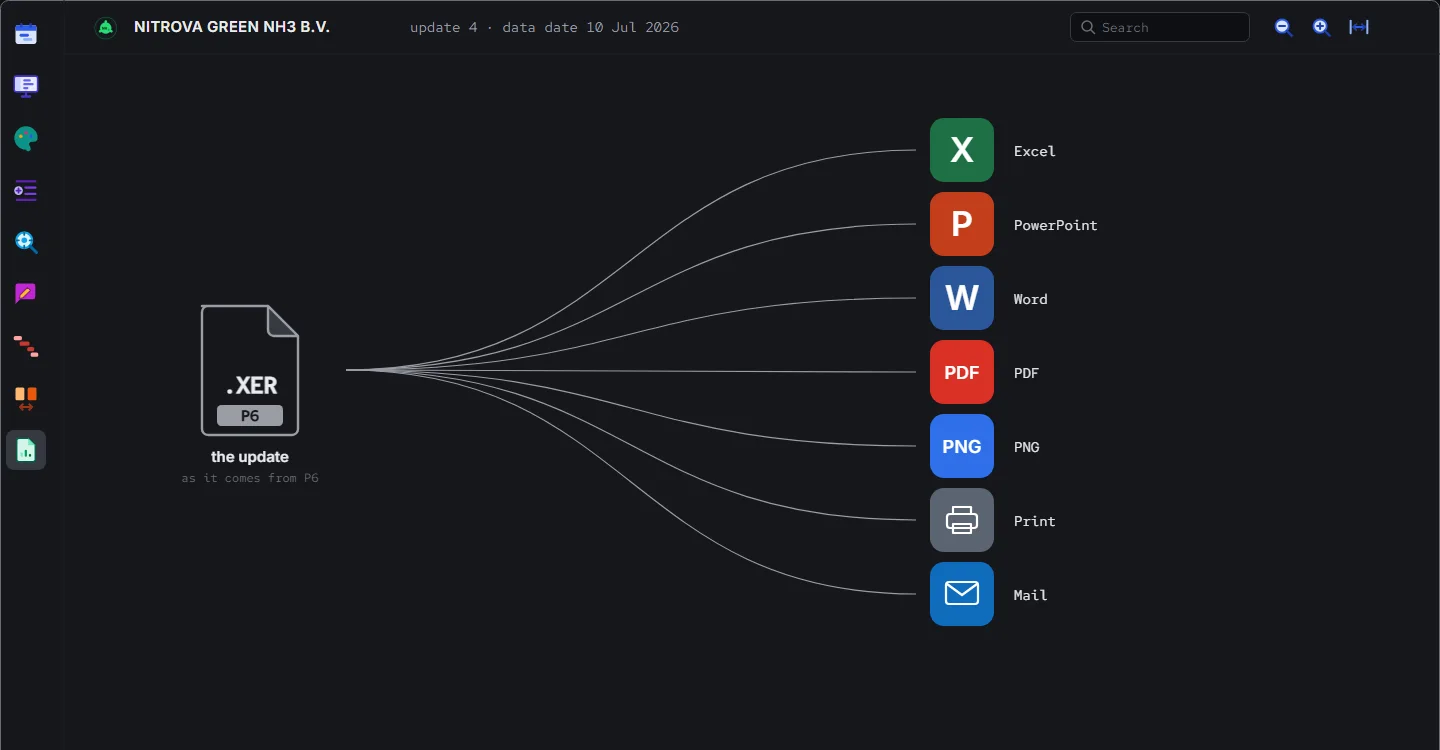
One file in.
Pick a date. Its links are the picture.
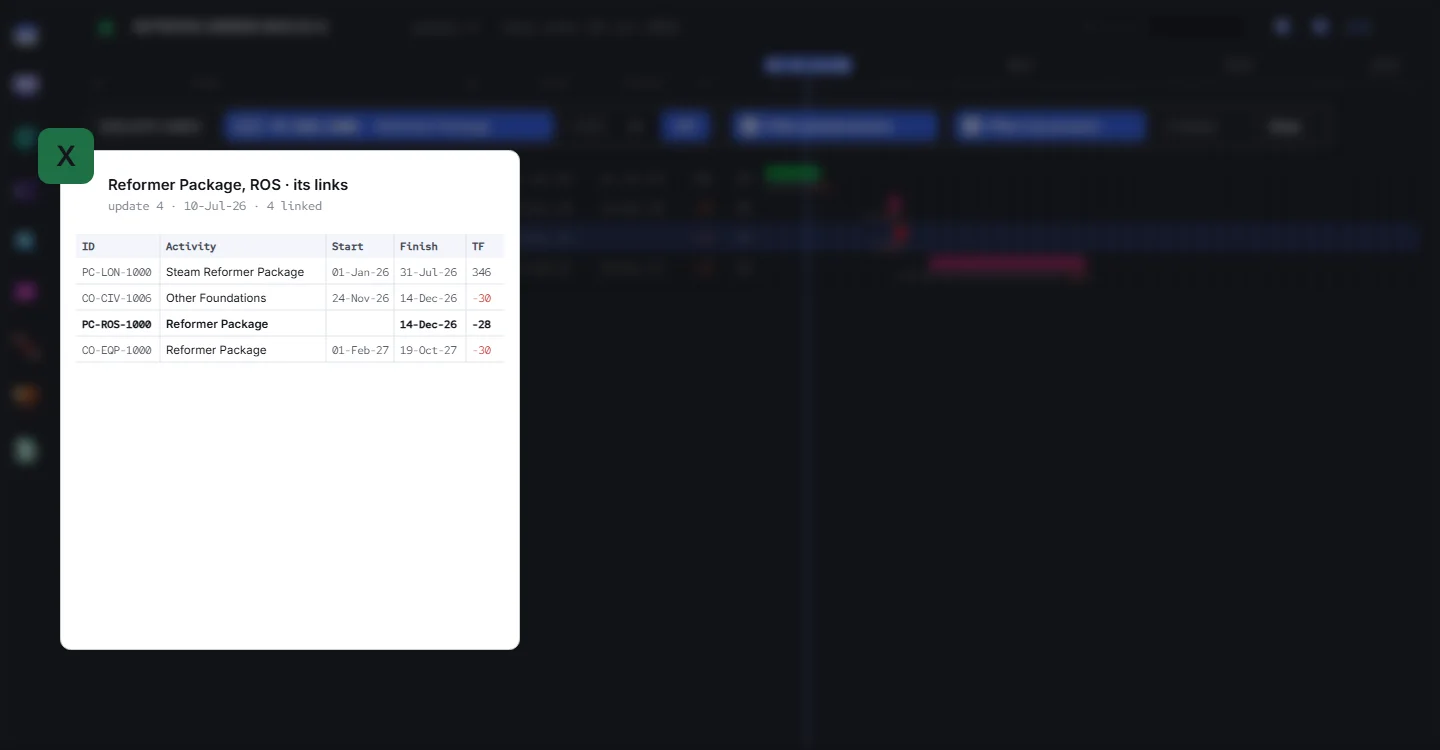
The same picture, as a table, a slide or a mail.
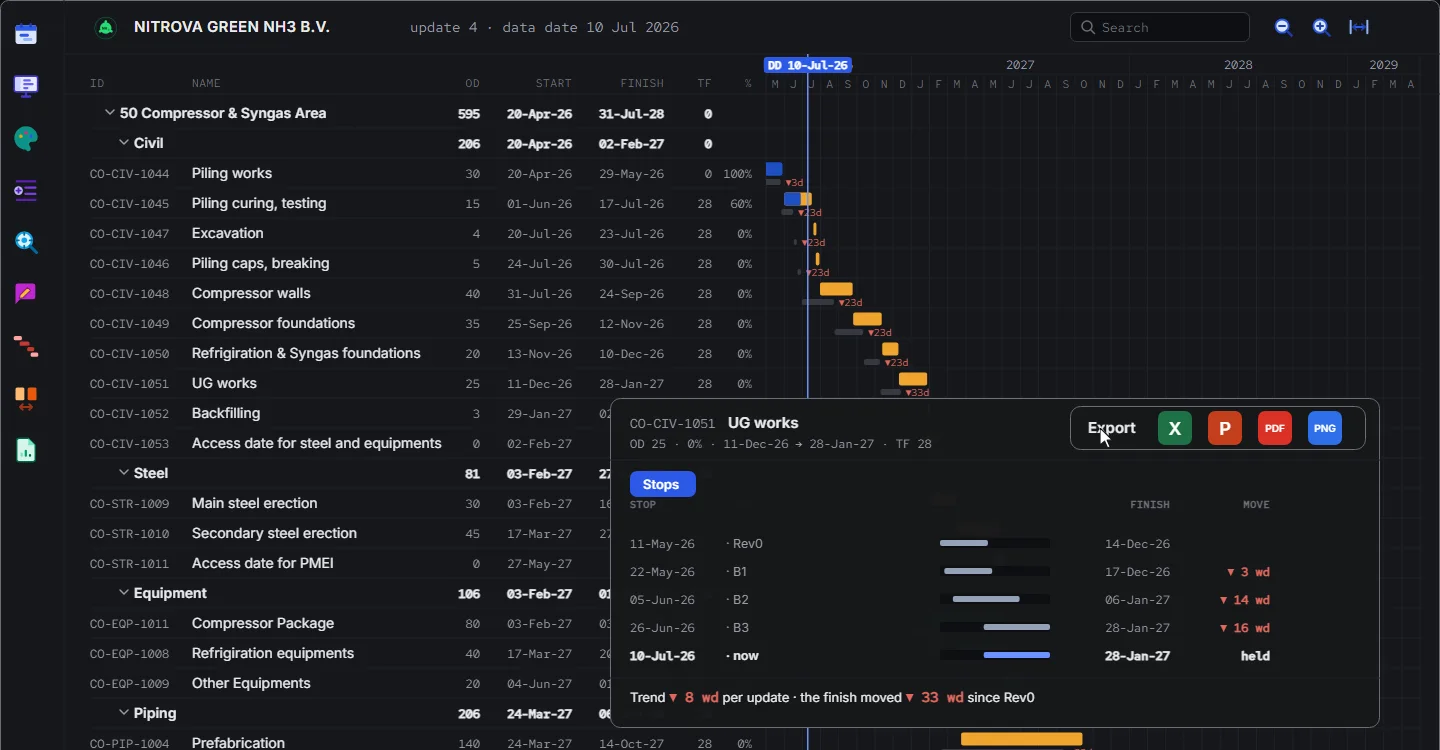
One activity and its history, out the same way.
Everything you see, board-ready.
- Answer the everyday question, “ROS dates against foundations against installation start?”, with a visual card, a data table, or both.
- Present what changed, in the schedule or in the progress, to a full room.
- Feed the repeating reports: the weekly, the monthly, and every one in between.
- Send the client the milestone report, visuals included.
- Get high-quality curves, with their data tabulated.
- Answer a quick email with a visual and the data behind it.
- Get the schedule basis and assumptions as a ready report.
- Keep a schedule dashboard, or the full report, live.
- Prepare business-level presentations with top-quality exports.
- 1
Open what you need to show.
- 2
Pick how it leaves: picture, PDF, spreadsheet, presentation or print.
- 3
Present it, or send it.
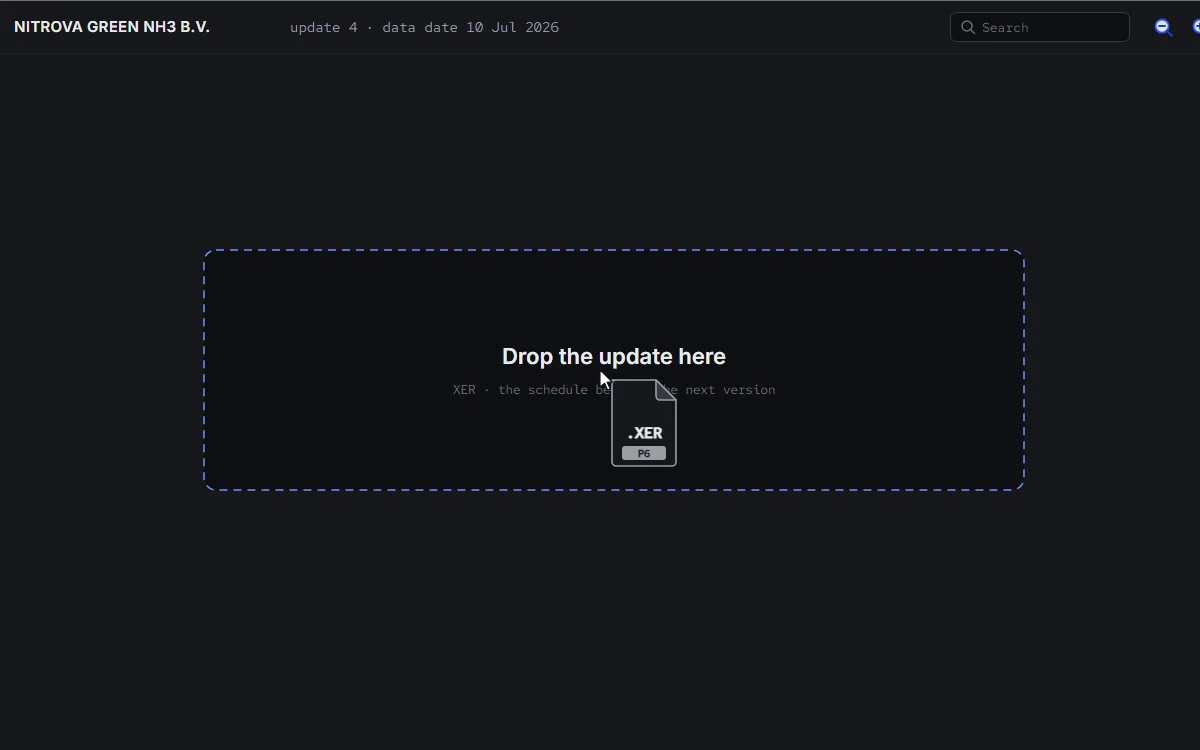
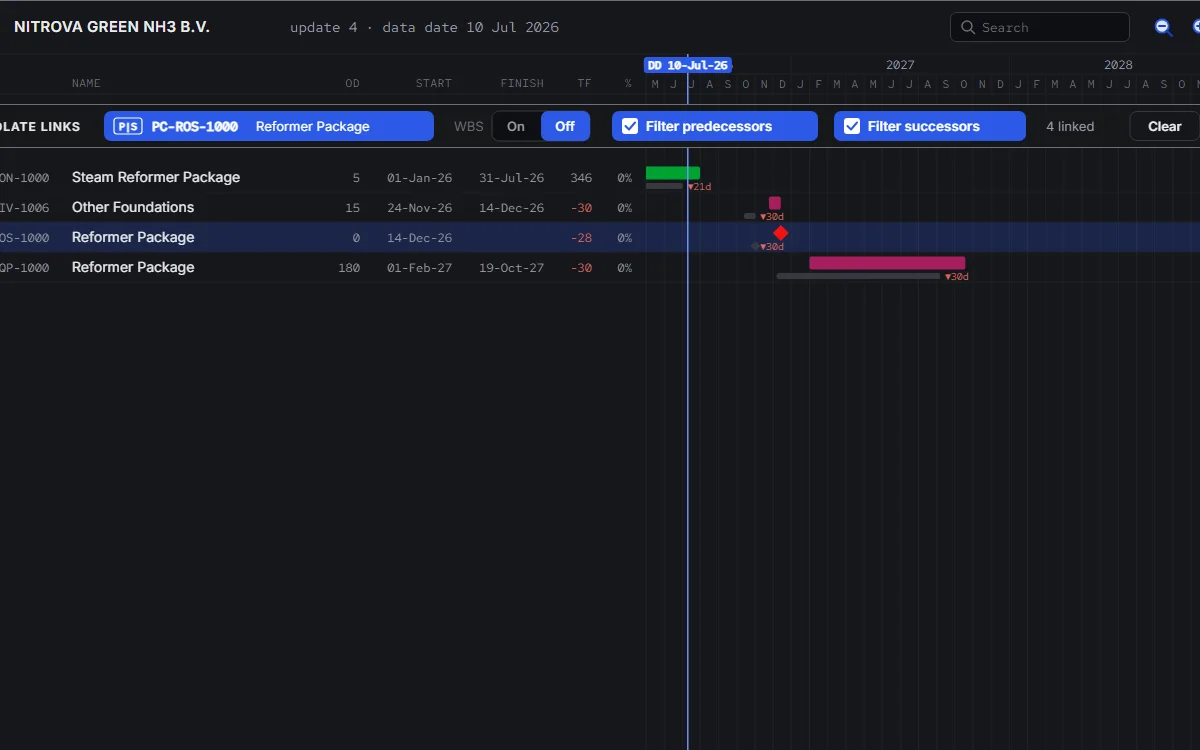
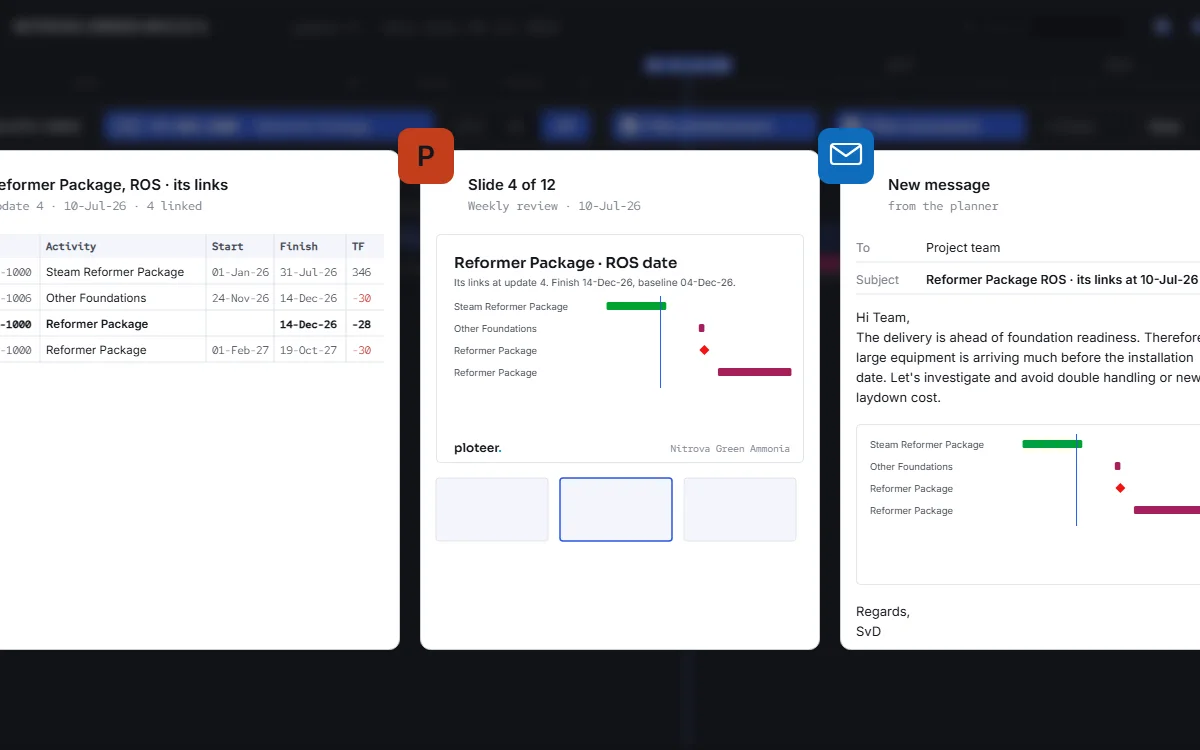
These outputs make the planner's effort visible.
Smart Boards put a complex schedule on one page. The rest of ploteer follows: every skill, app wide, comes with its export.
Every planner knows that walk. A screenshot that blurs on the big screen. The numbers pasted into a spreadsheet, the spreadsheet made nice, the result dropped into the slides. Then the schedule moves, and the walk starts again. In ploteer the walk is gone. What you see goes out as it looks, all from the same update, so the numbers agree wherever they land.
The everyday question gets its answer on the spot. Required-on-site dates against foundations against the start of installation: pick the activities, or the chain, and they go out as a visual card, a data table, or both, each with its history behind it. The quick email gets the same. And when a note from Fogg says it best, it goes in as a picture.
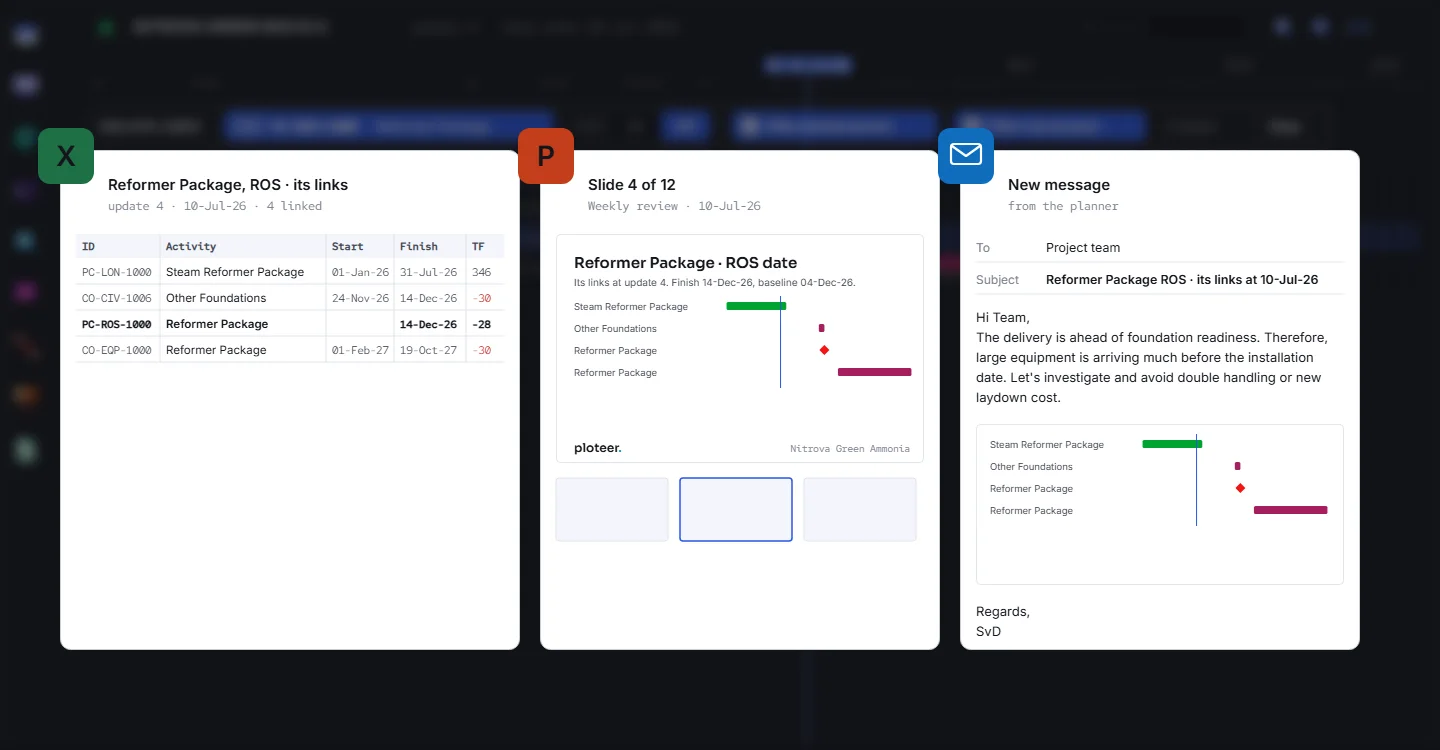
For the full room, what changed in the schedule and in the progress is a report already, and it opens as a presentation. The curves go out as a picture, or as a spreadsheet with a real chart and the data beside it. The smart layout goes on the wall, on A3 or as a PDF.
The repeating reports stop being a job. Take the pieces or take it whole: the schedule, the comparison, the dashboard and the curves in one report, as a PDF, a spreadsheet or a presentation. The milestone report comes the same way, visuals included, and so do the schedule basis and the assumptions. The dashboard and the full report stay live: refresh the update, and they are current.
Days of work sit behind every update, and a plain printout does not show them. Not everybody is a designer, and no planner should have to become one. What leaves ploteer needs no polishing: top-quality exports for your own presentation, or better, the whole report, finished.
Nothing pasted, nothing redrawn. The result is ready when the question is.
Let us meet for the demo.
Book a demo