One online app, three perspectives on planning.
See, understand, analyze and report every planning decision, in a few clicks. Smart Boards to see it, Schedule Dynamics to understand it, Fogg to prove it, in the browser.
The schedule on the site layout.
Smart Boards puts a schedule of thousands of activities on one page: a site layout, a picture, a 3D model or Google Earth. It is made to make the schedule visible to everyone. Our users show their dates, their progress, quantities, hours, the critical path and the slips on the board, with dozens of other fields, and the board is responsive: by the state of the data in it, its colours turn to warn the reader of what is coming.
From the milestone to the discipline, down to the level 5 activity, everything shows with its progress and its status. A new update refreshes the board. The output is high quality: print it, export it or present it live on the screen, as the purpose asks.
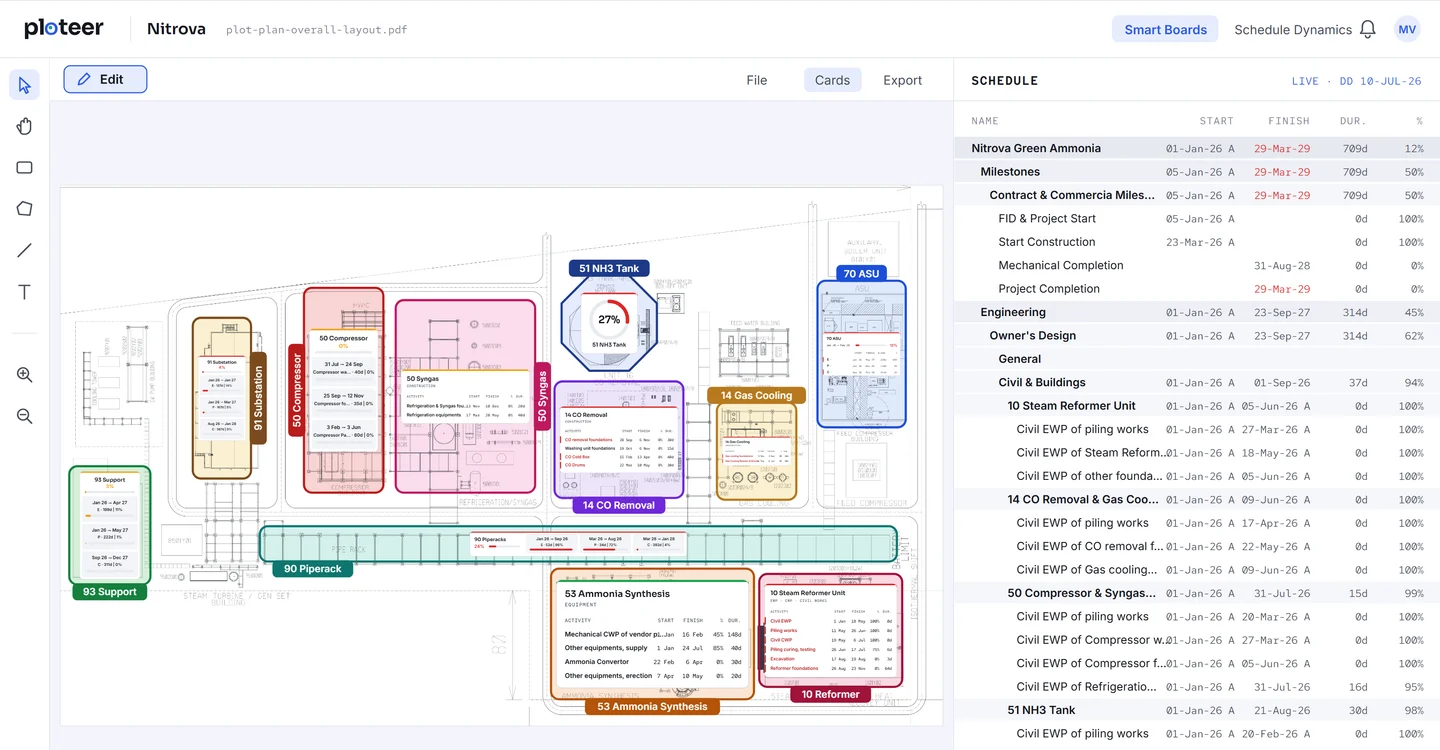
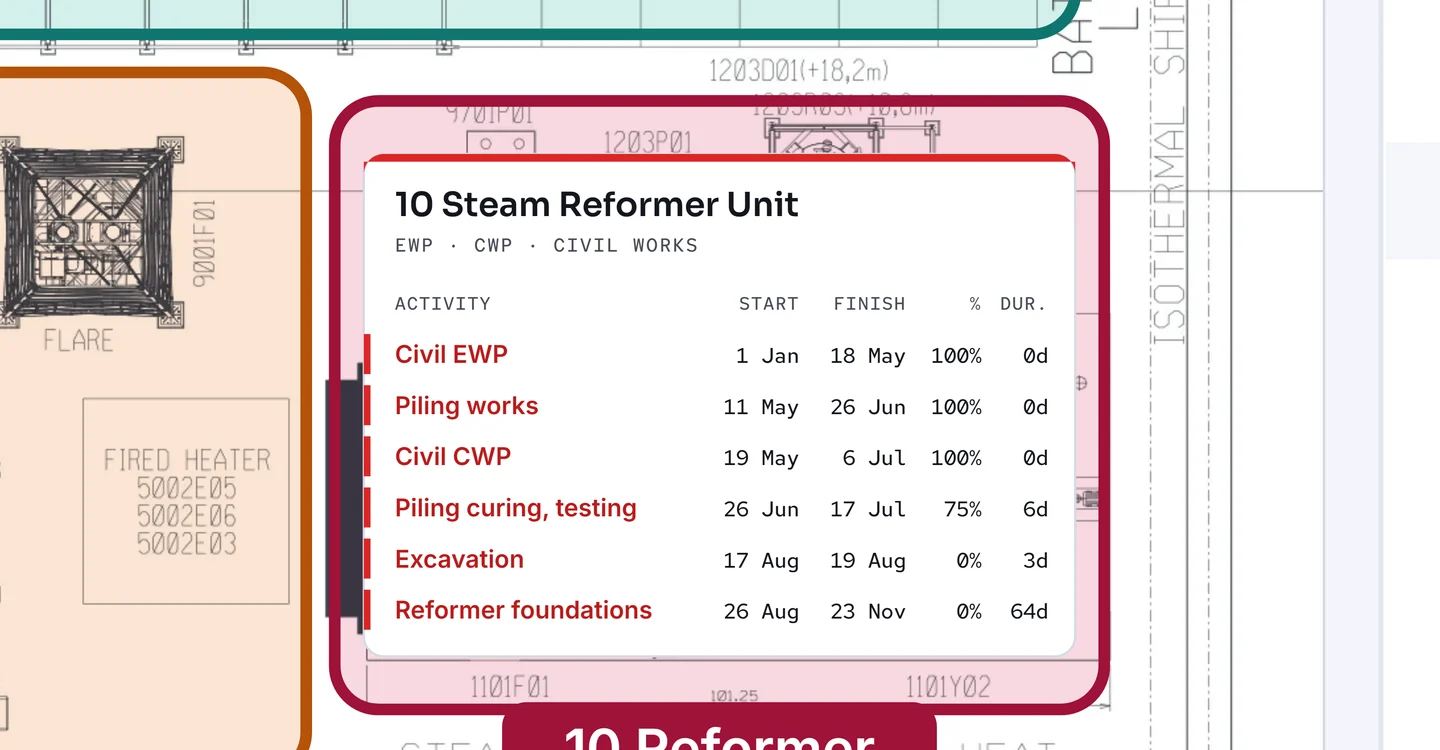
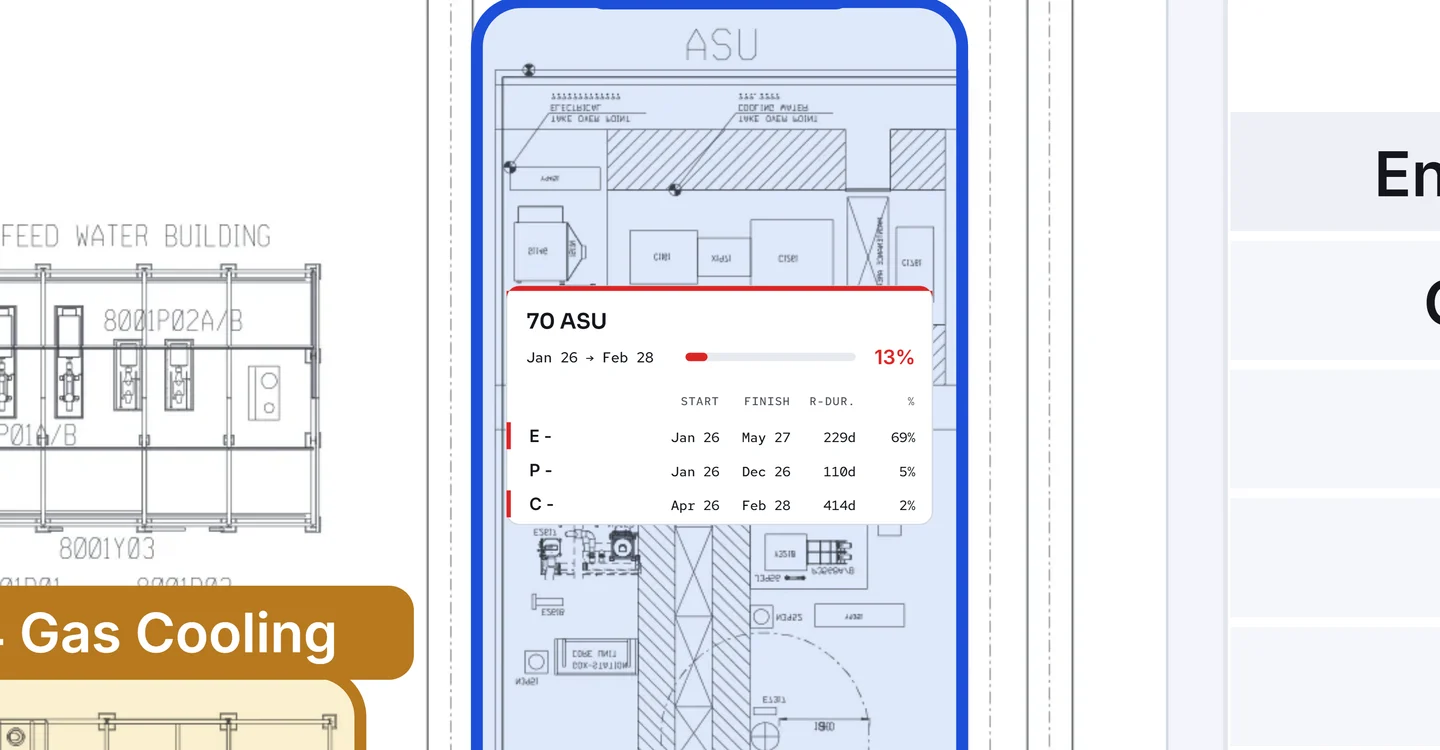
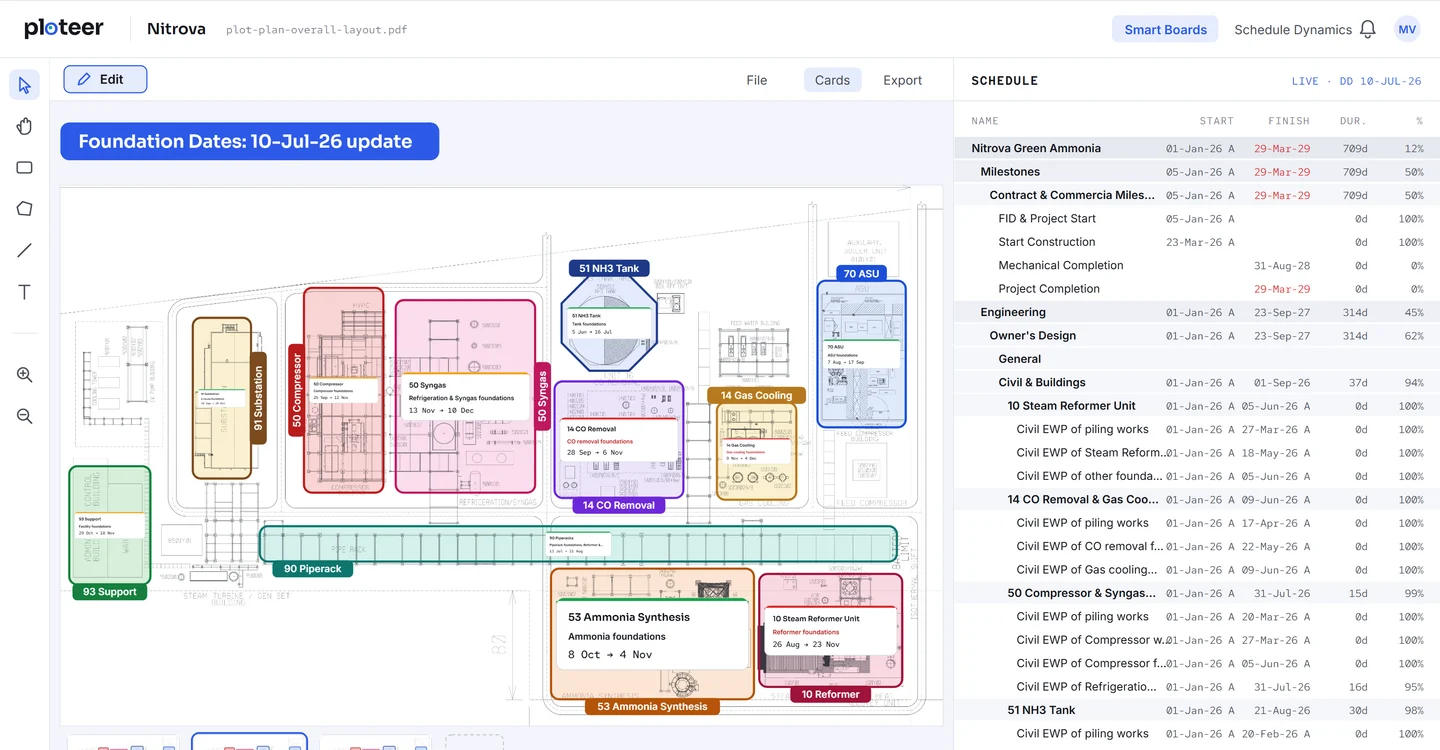
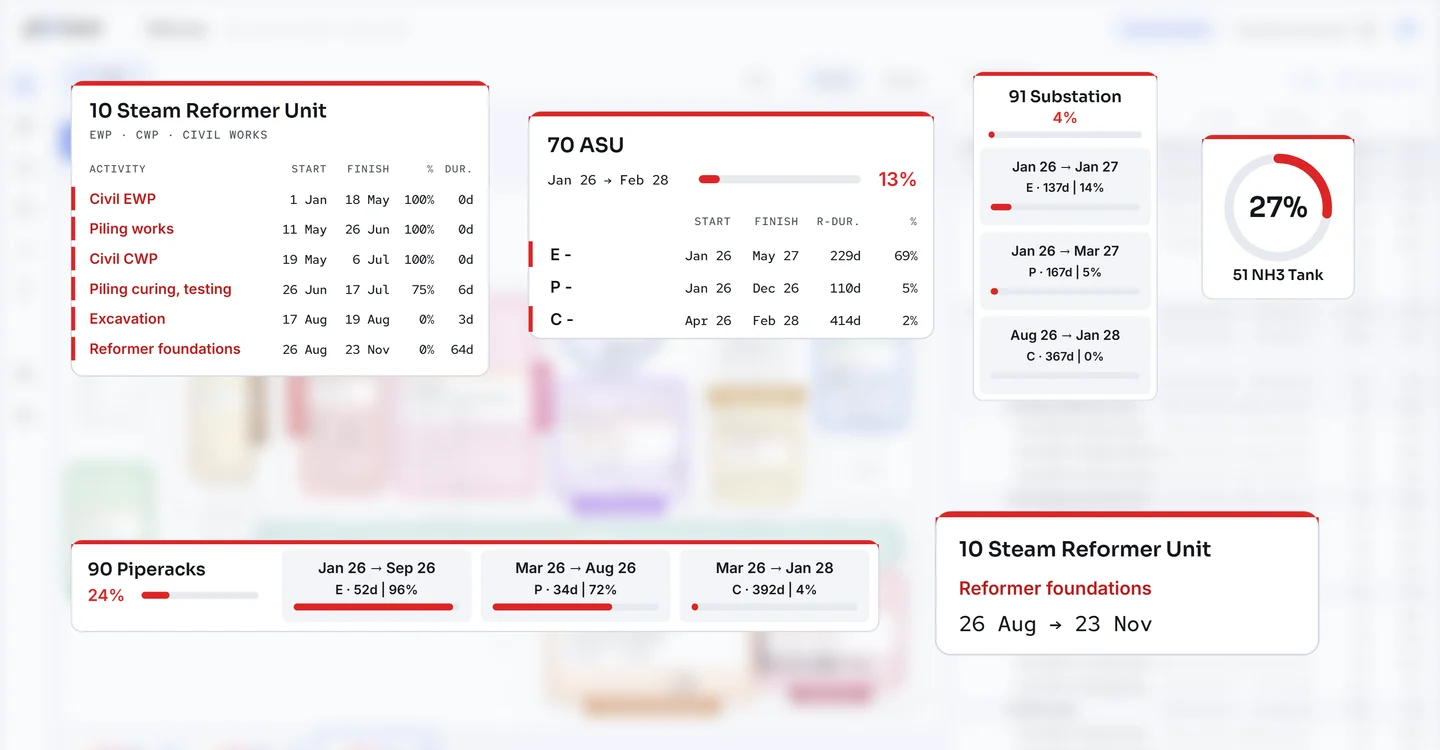
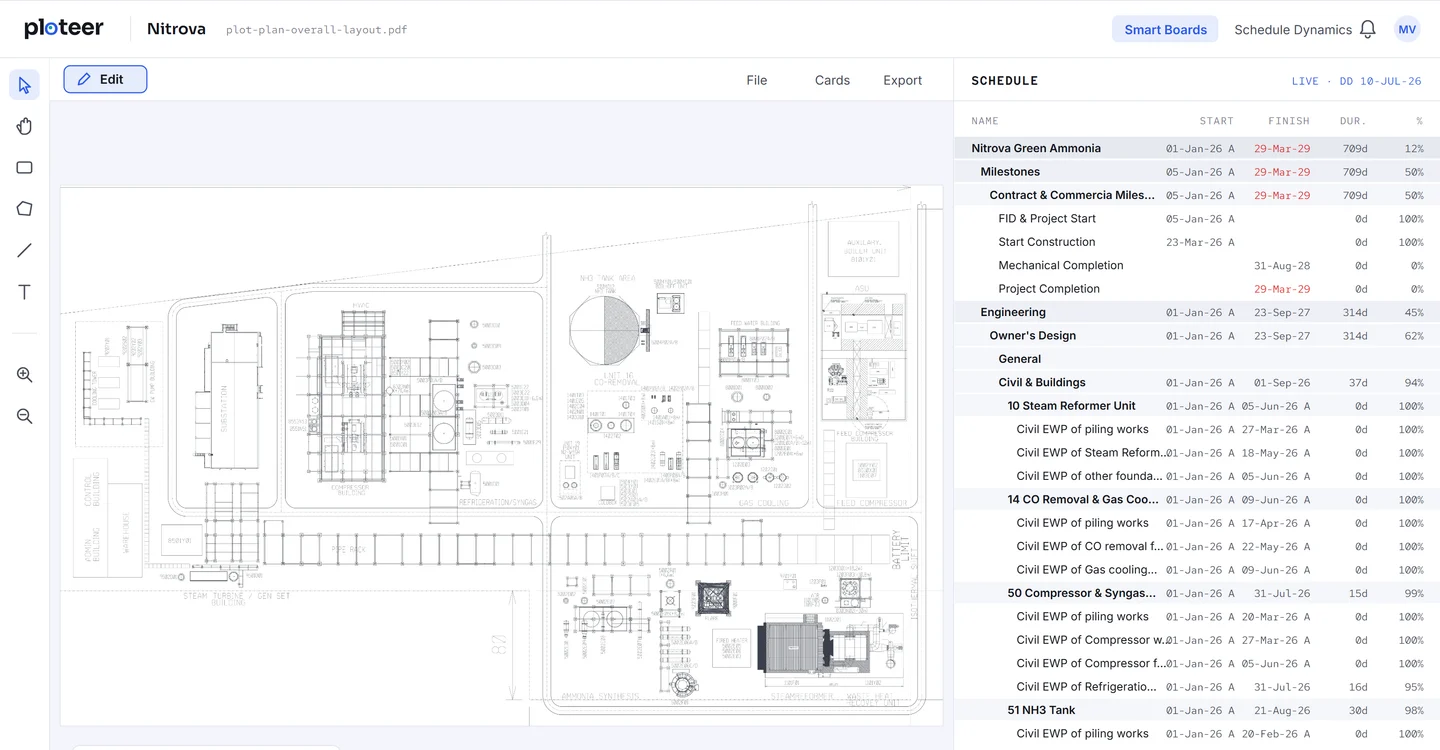
A few boards Smart Boards can present, but not limited to these: EWP, CWP and IWP dates per building or per foundation; procurement, ETA, ROS and installation date per equipment; discipline summary or details per area; handover dates from one party to the other per building; piping progress per package; cable route readiness per route; commissioning readiness per system.
Release notesWhat changed, release by release
Analytic planning from a dynamic schedule app.
Schedule Dynamics is the working set of the whole team. Every dynamic feature is one click away, to read the schedule, analyse it and challenge it: where the plan came from, and where it is driving. Every update is reviewed the moment it lands, against the one before it, so when the decision moment comes, the findings are ready before anyone asks.
It is fast and responsive, unlike traditional software. It reads the schedule from top to bottom and from the oldest version to the newest, in seconds, and lays the result out on the screen. Pick one, and the output is already there, as a presentable visual or a table. The history, in a moment.
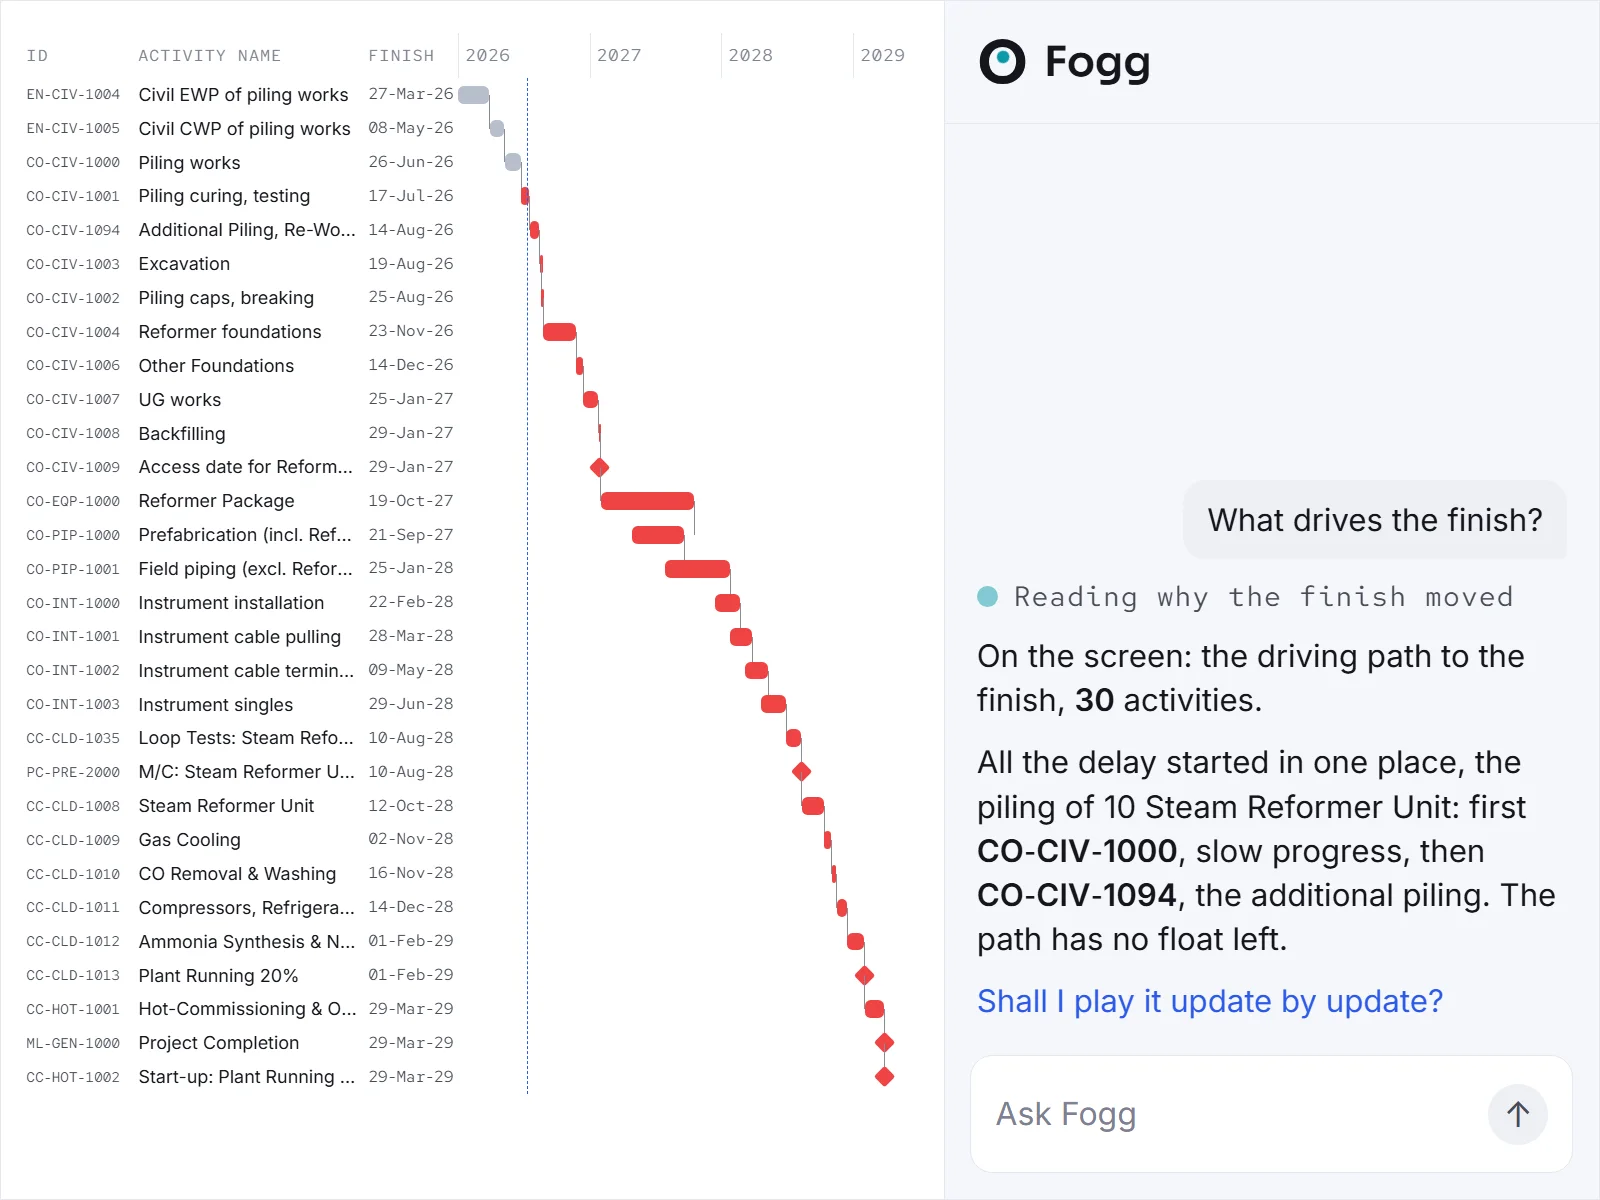
A manager’s portfolio, two projects or many, sits in one place. Critical path, longest path, float paths, the driving chain of any activity or milestone: ploteer draws them live on the screen. The team focuses on the result; the app does the legwork.
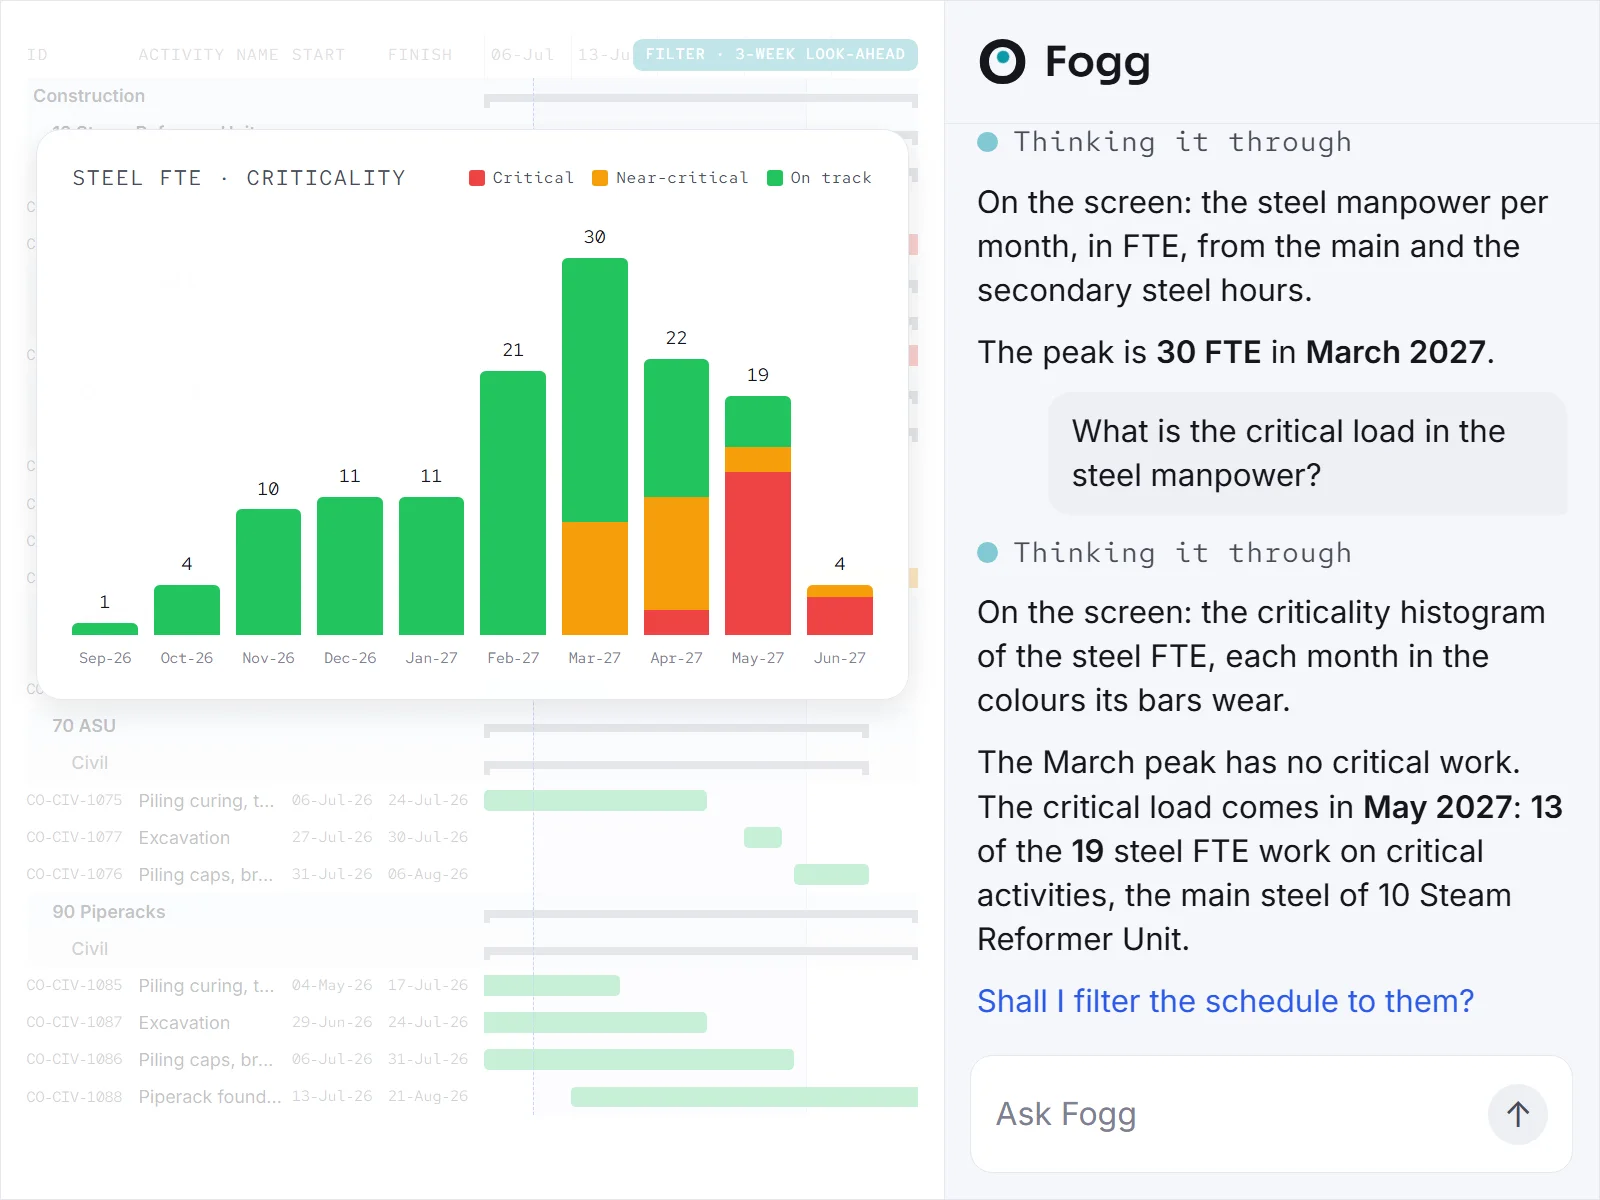
The workload has its own place. The resource loading sits under the Gantt, every bar sliced by month with its FTE, and seven charts read it: the histogram with its S-curve, the peaks a steady crew cannot follow, the critical load, the bow wave, the trades stacked, the density and where the hours sit.
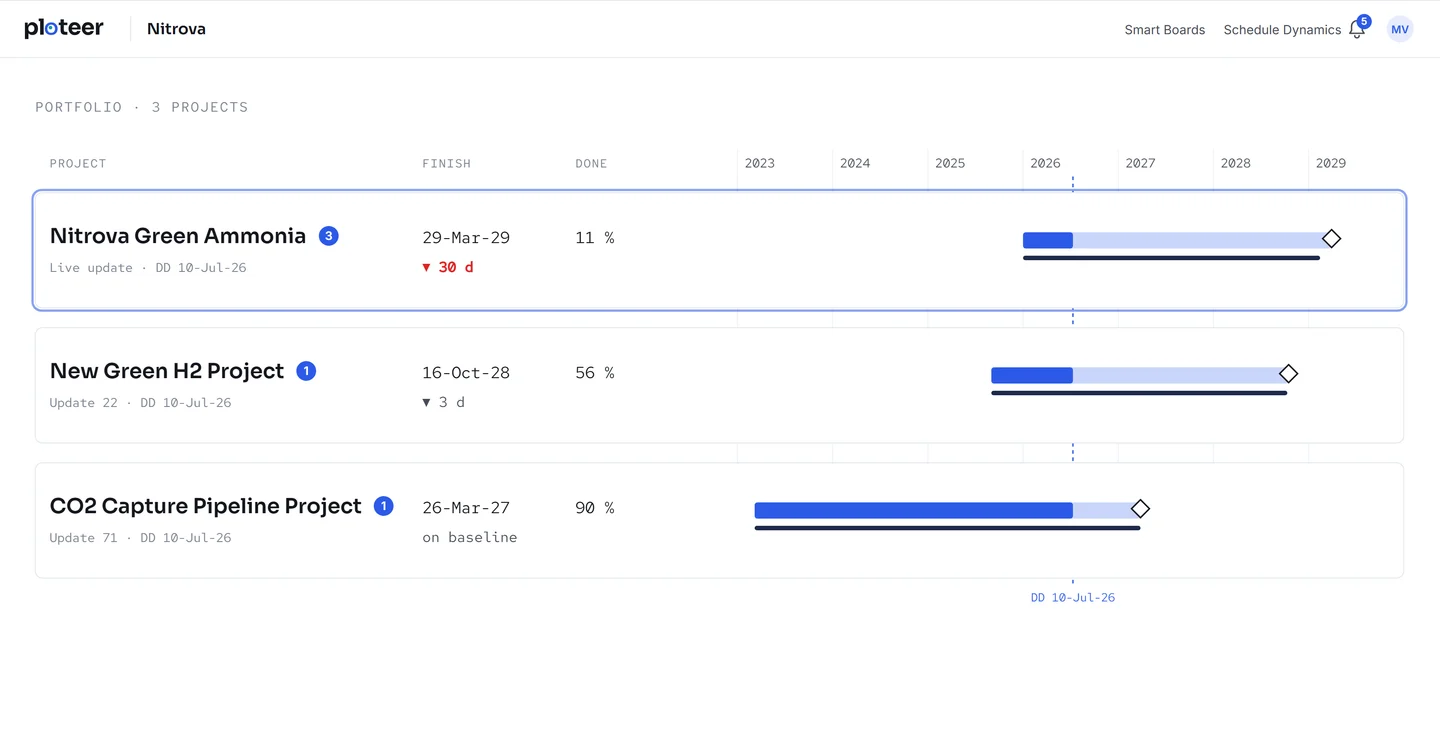
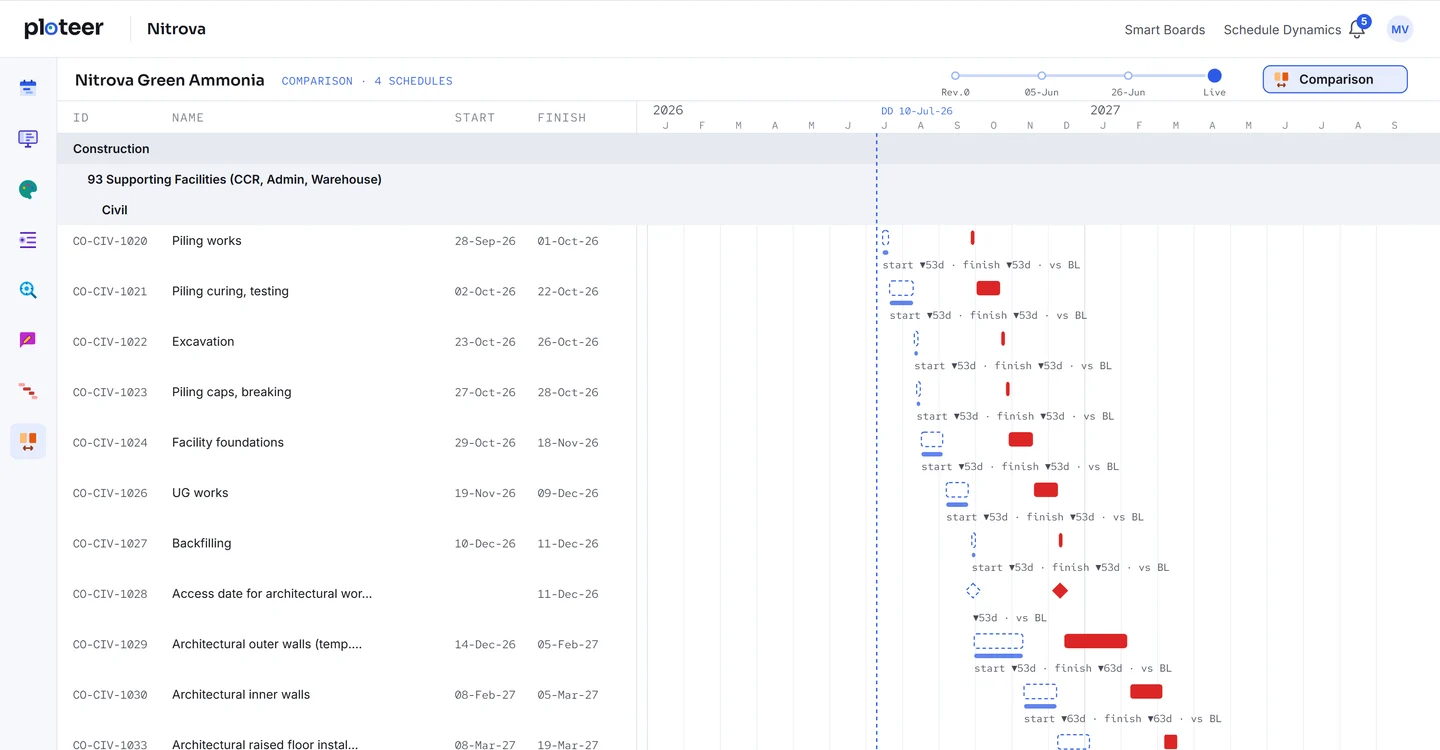
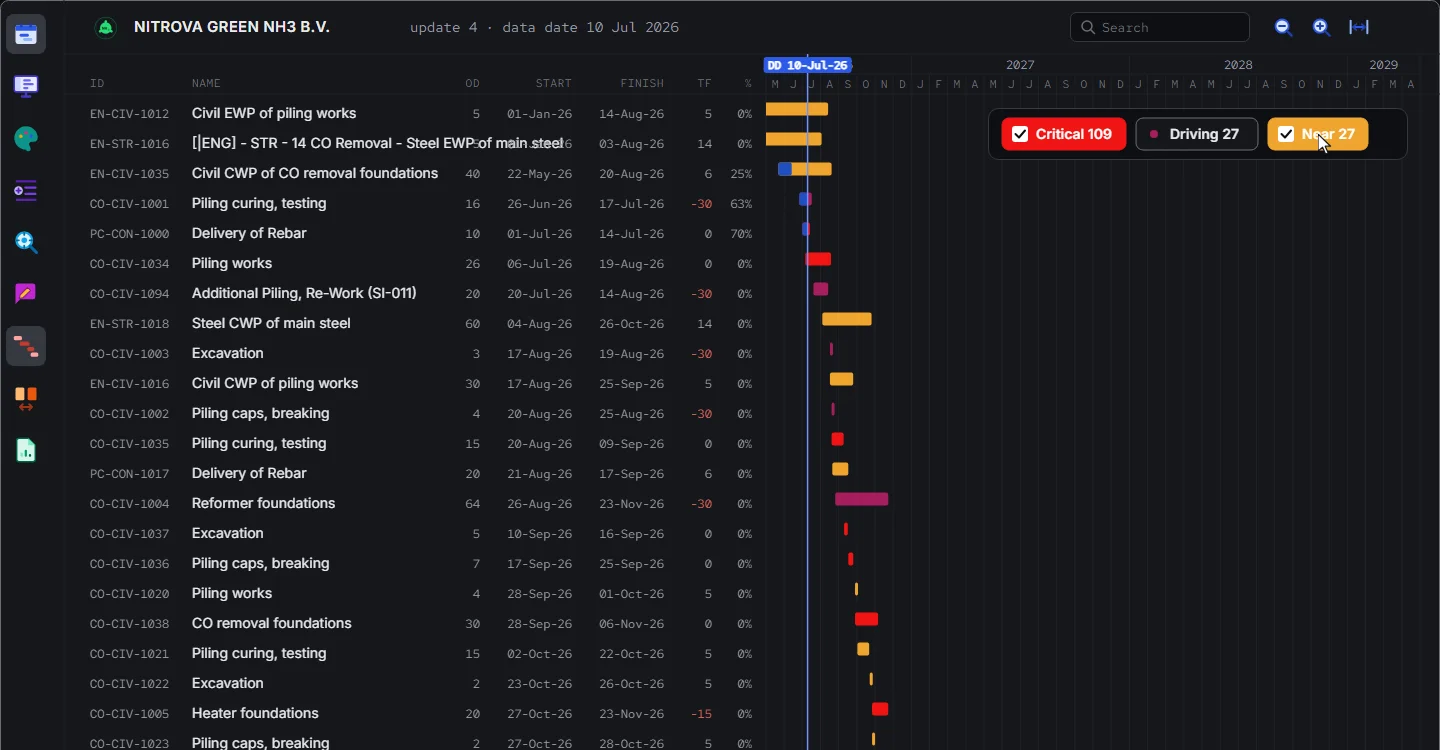
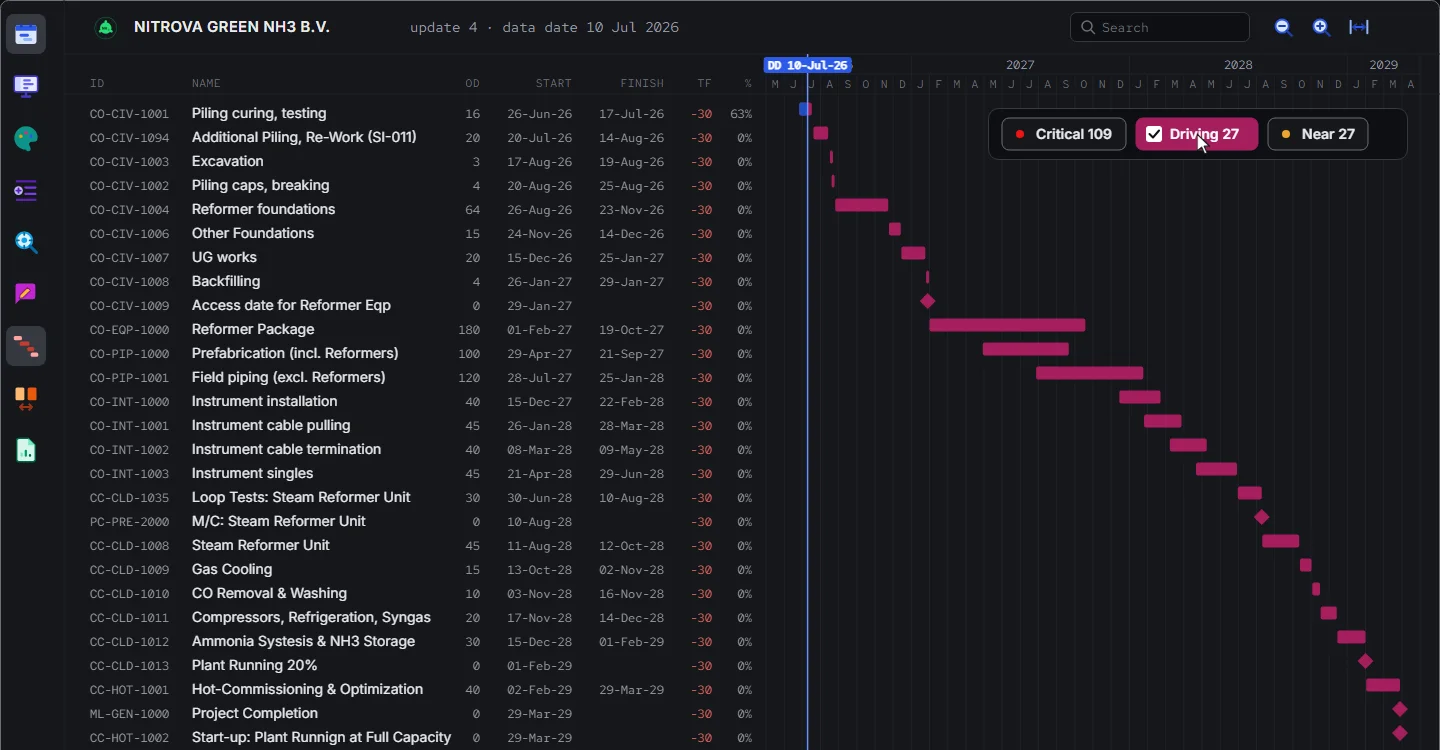
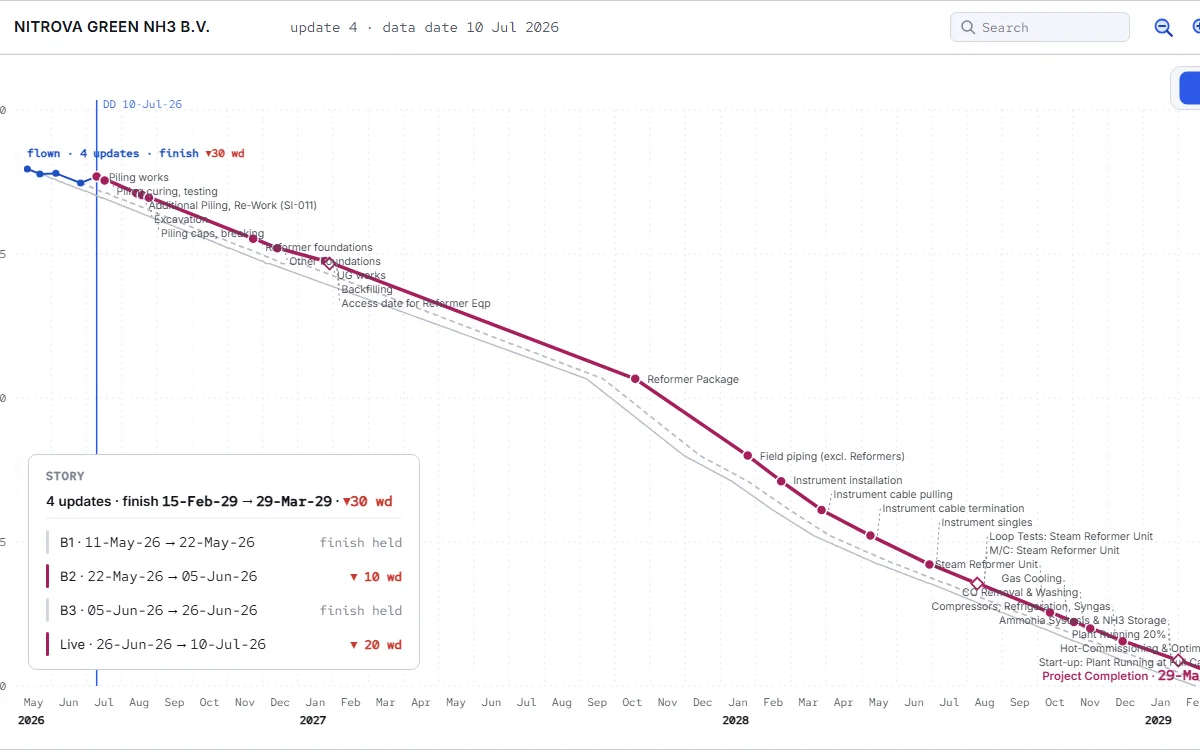
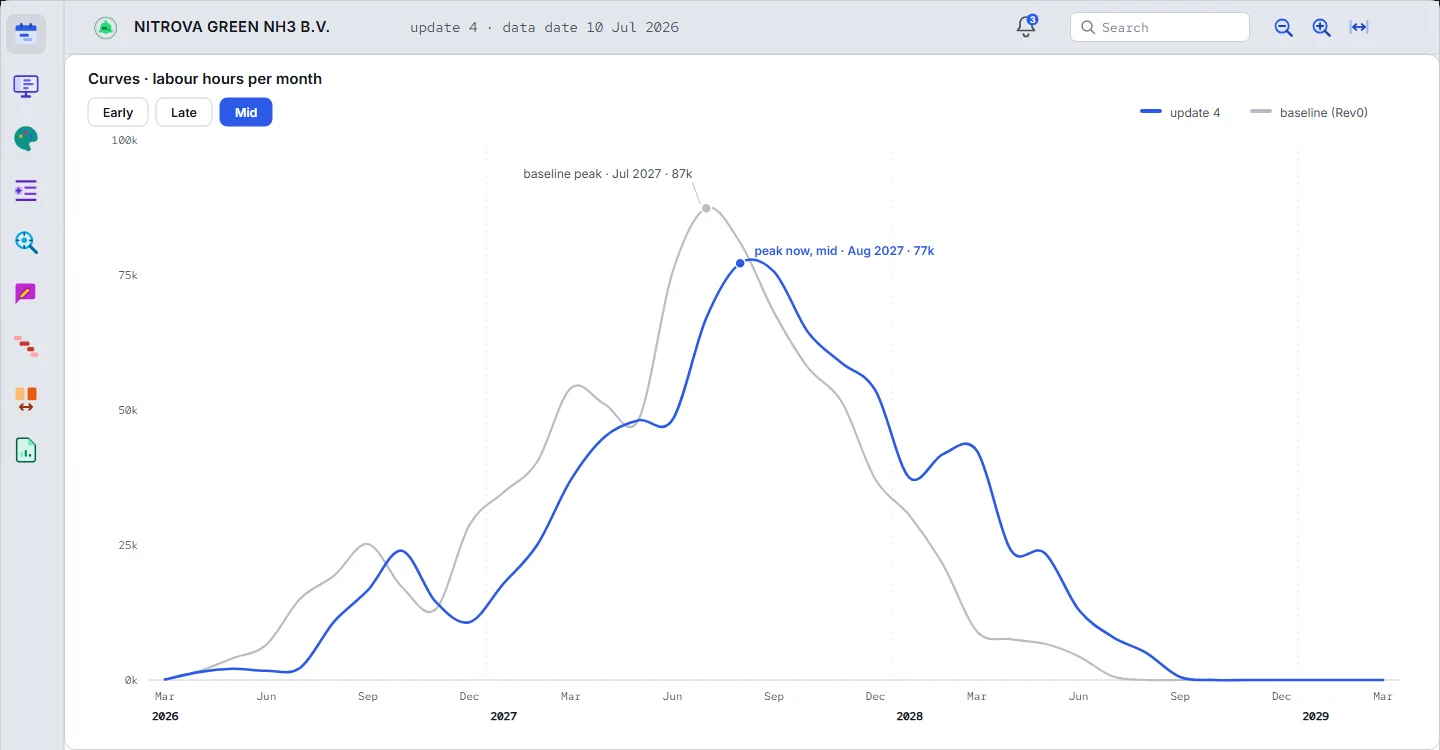
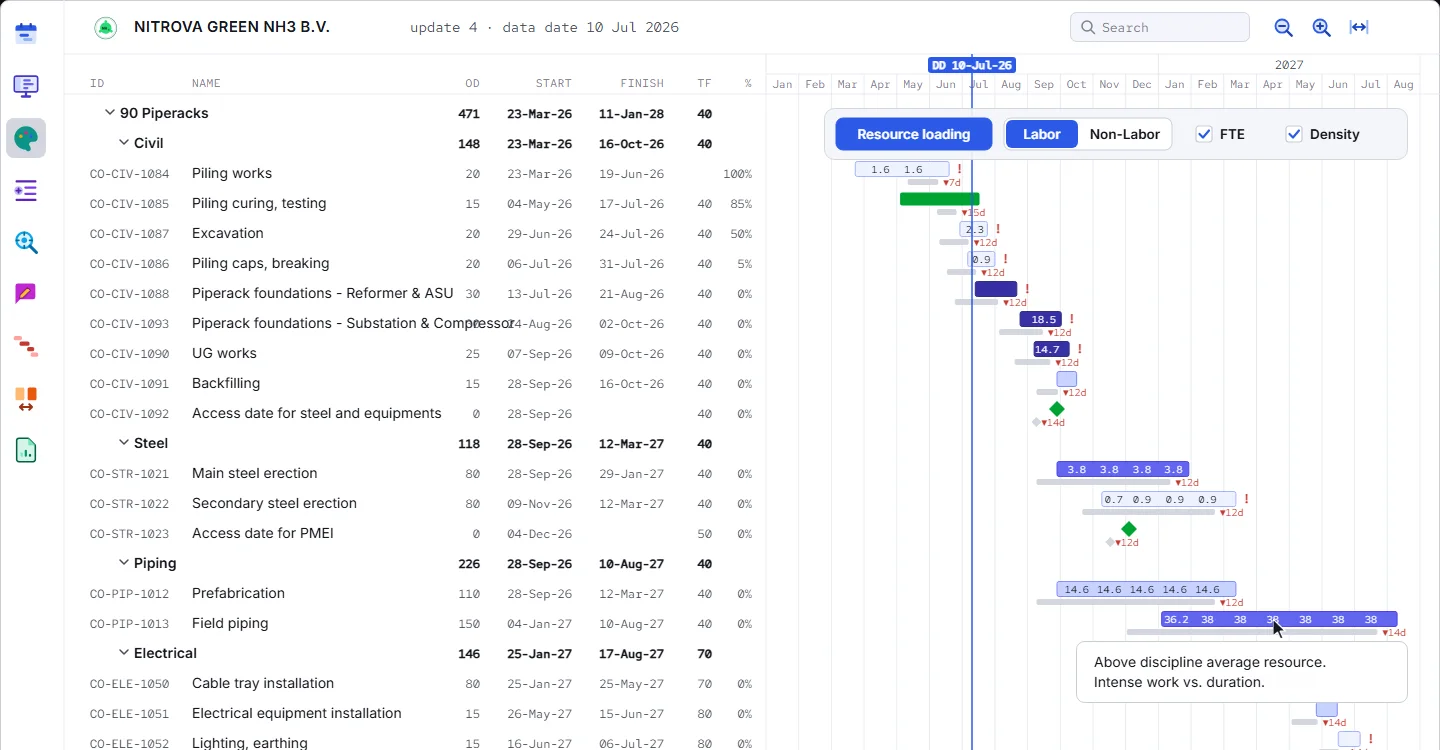
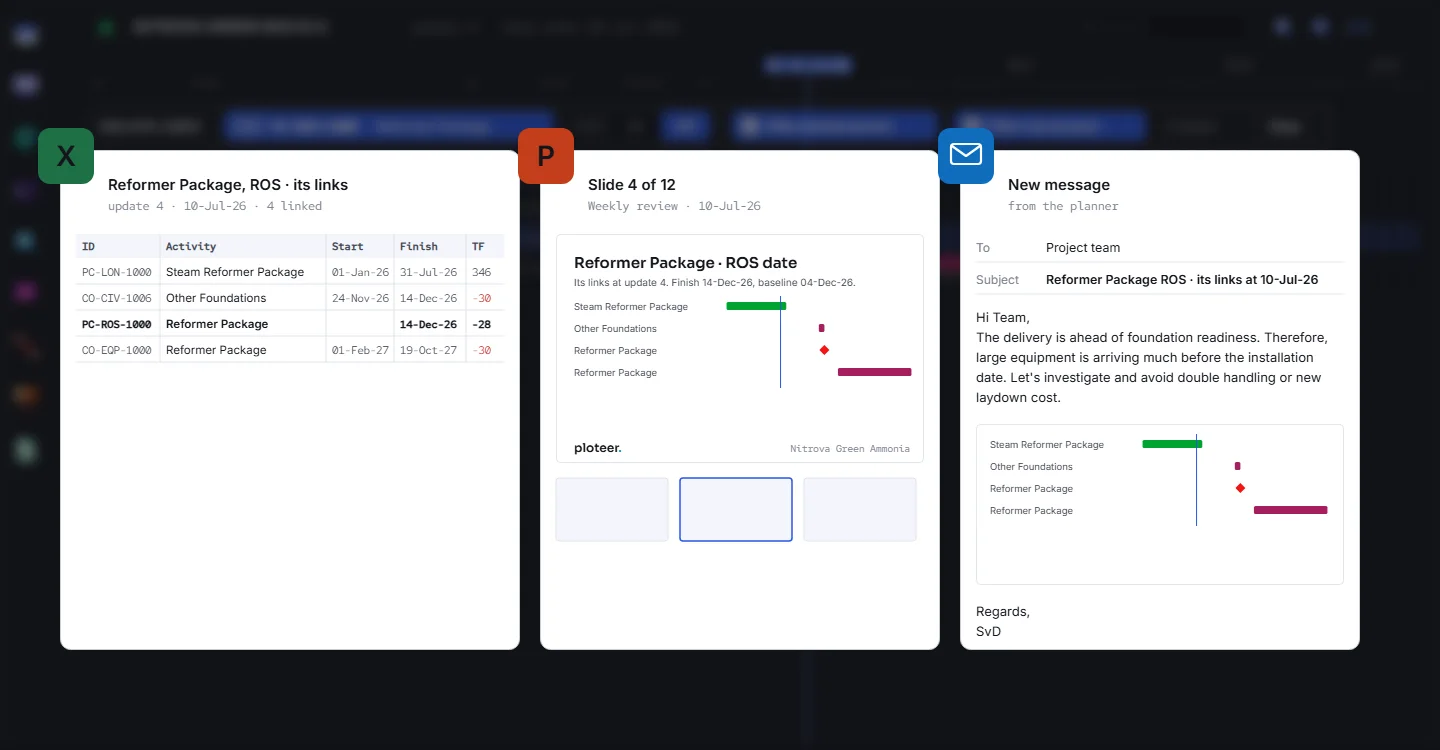
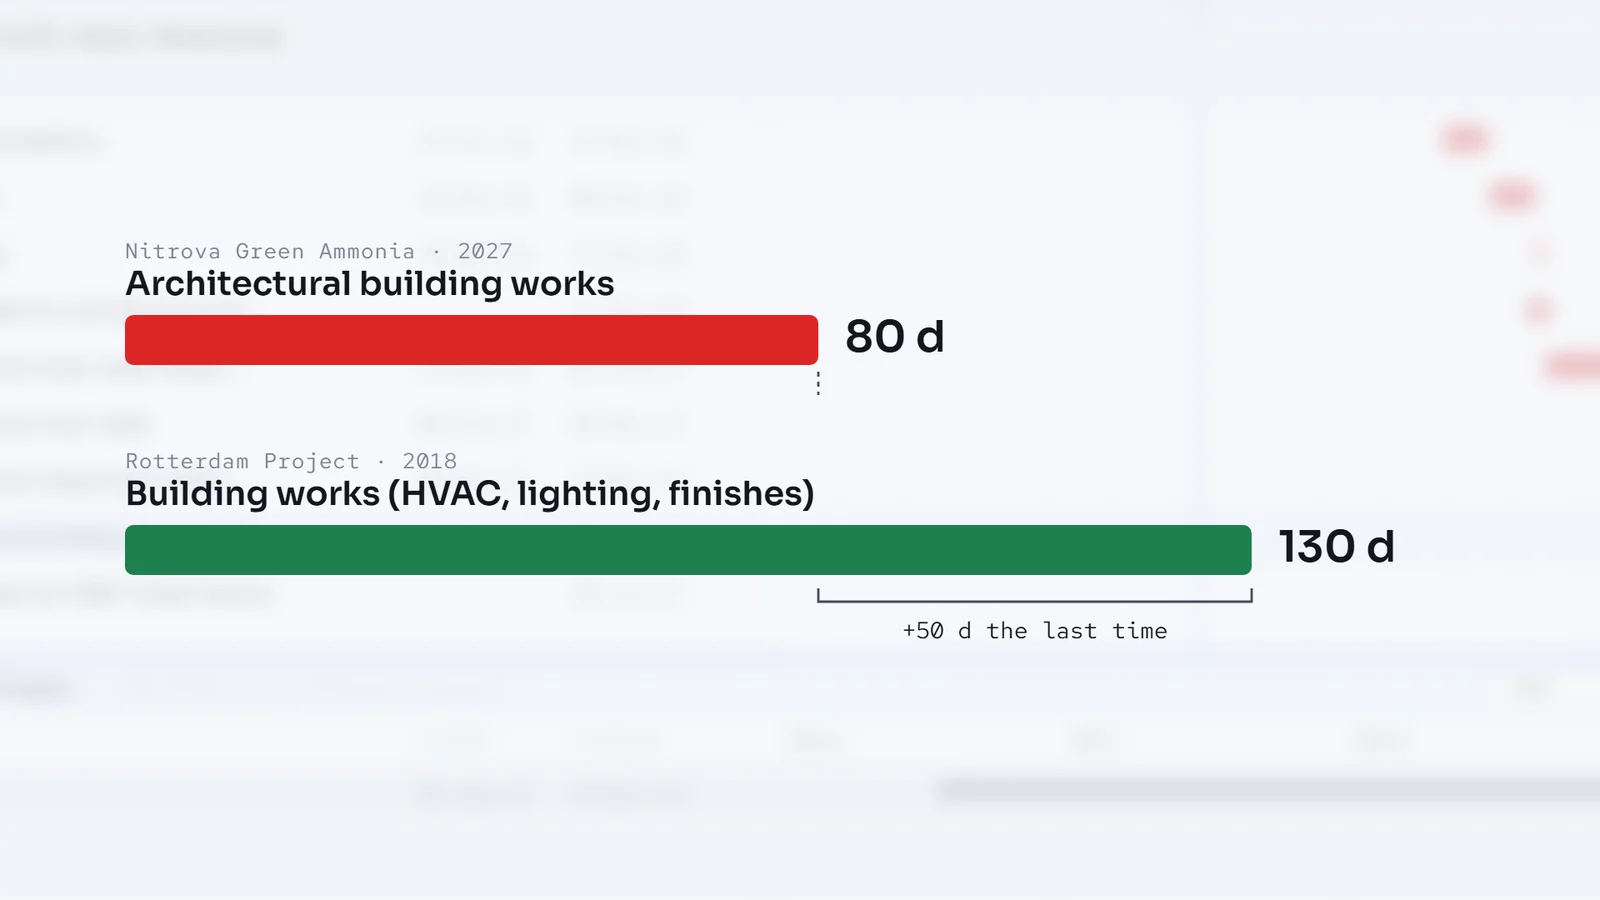
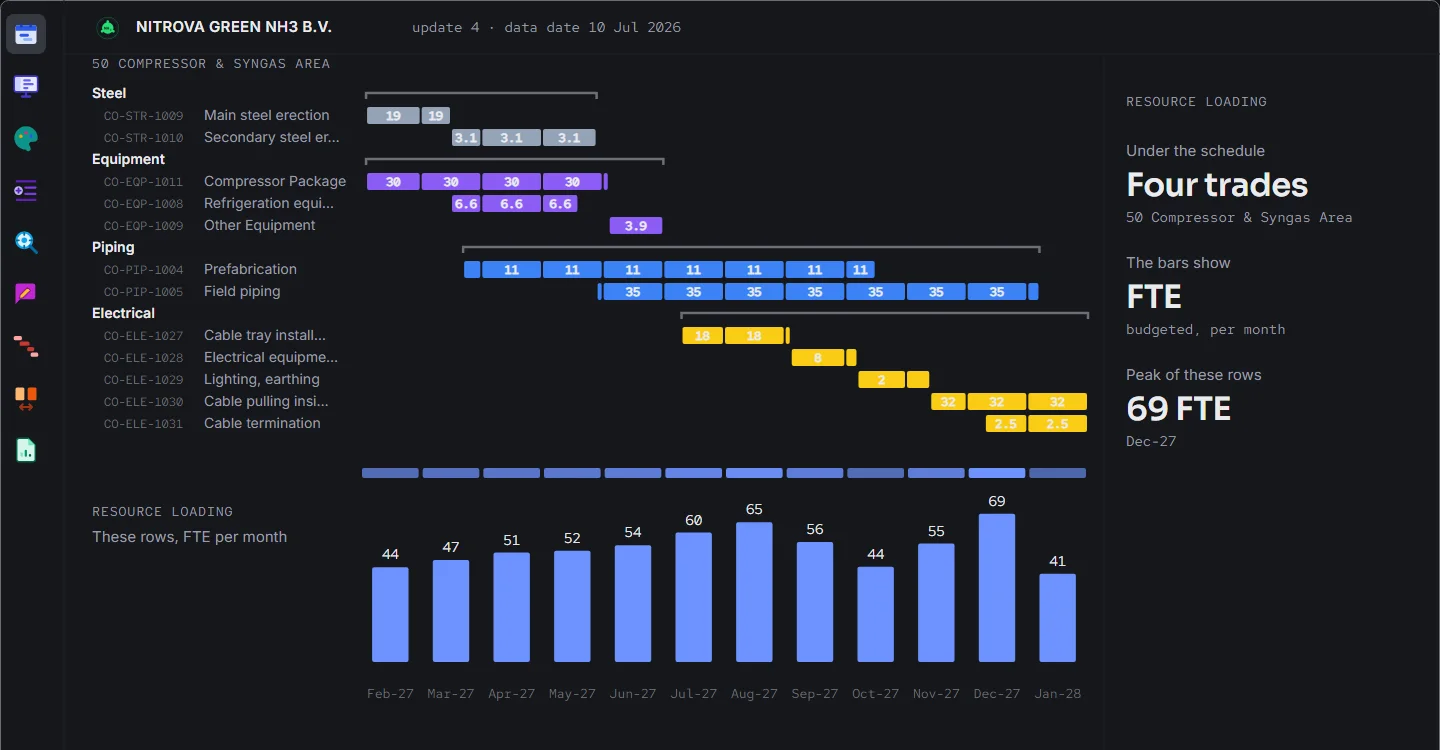
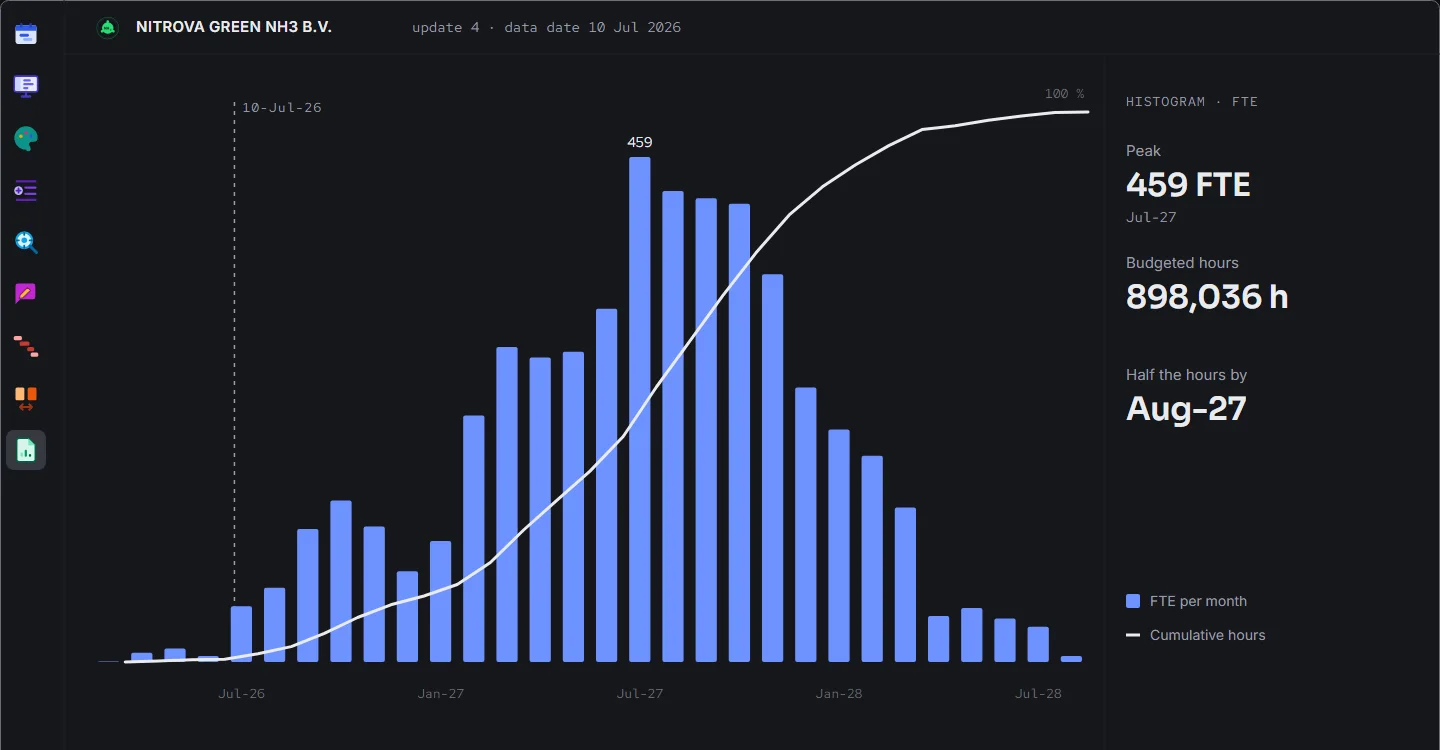
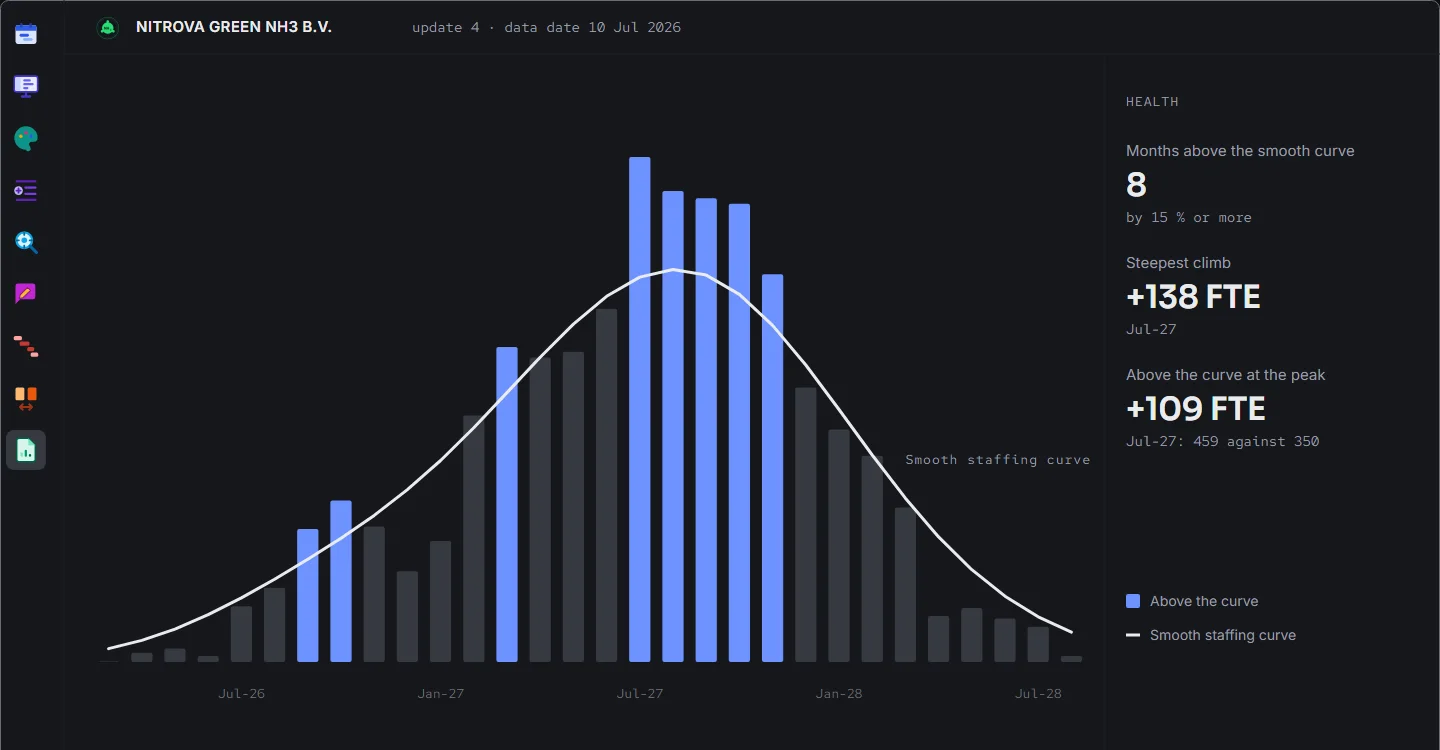
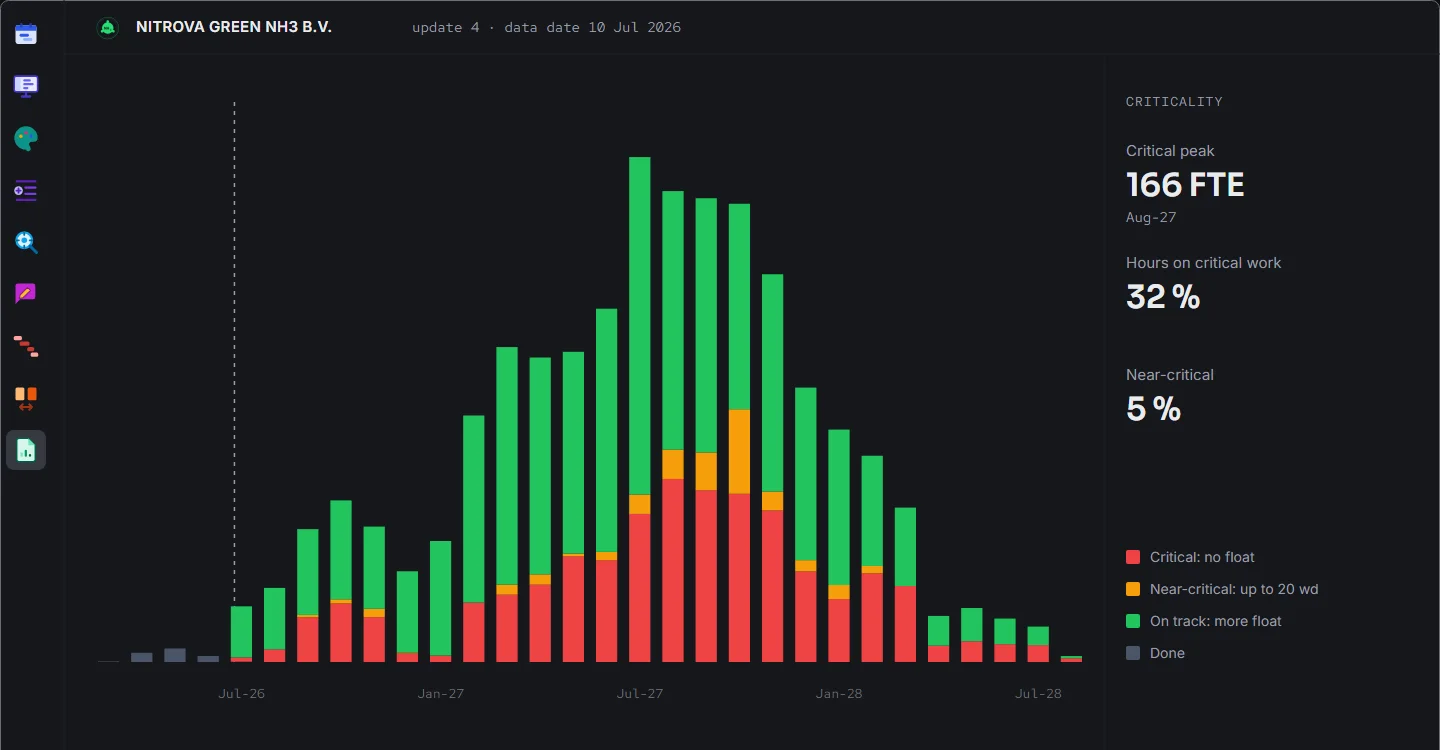
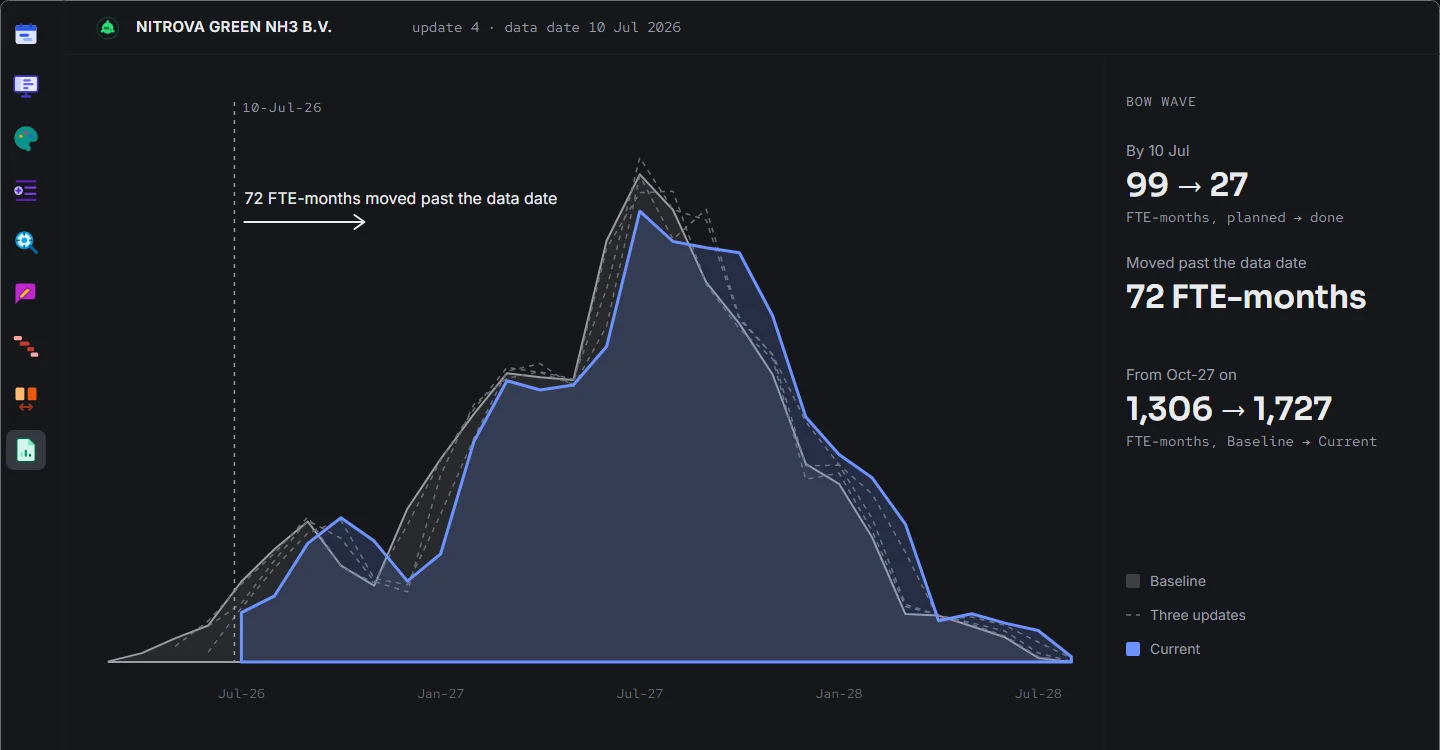
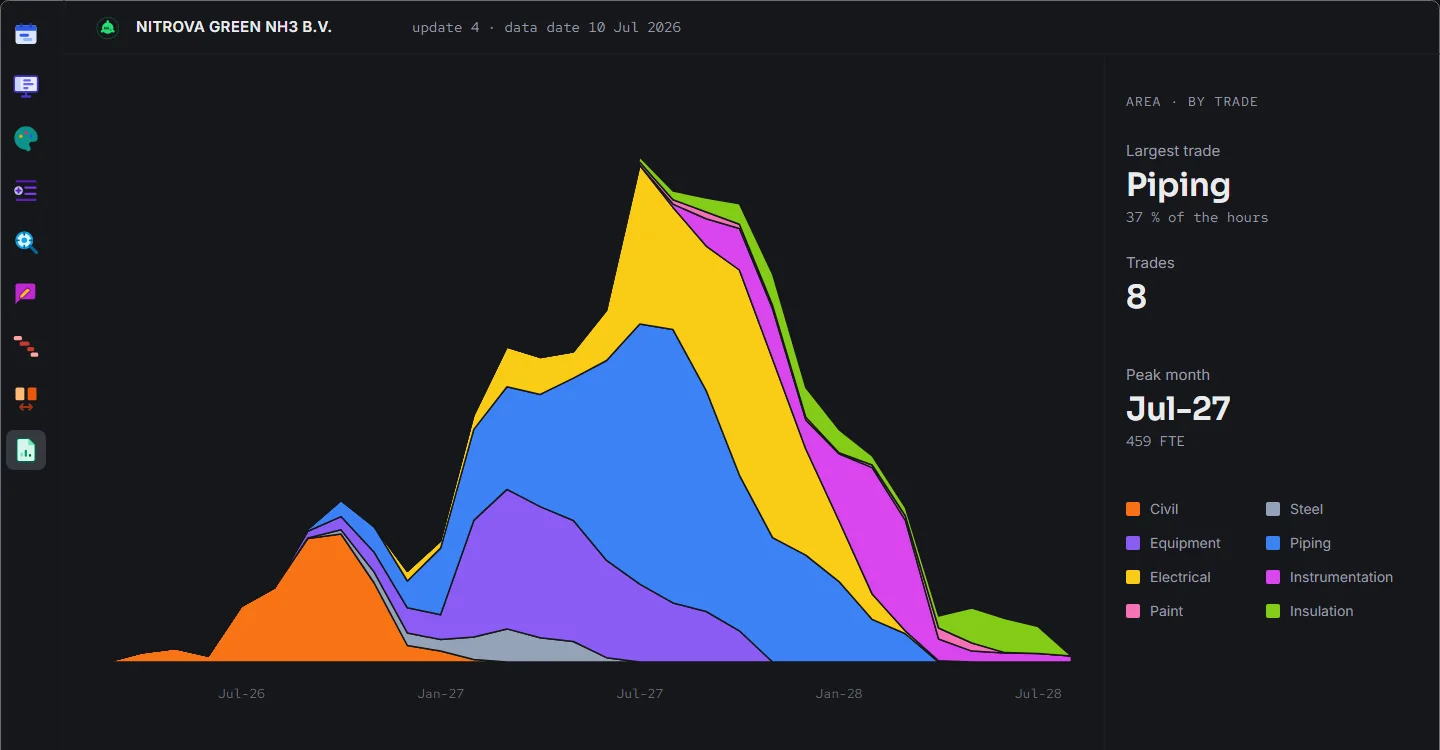
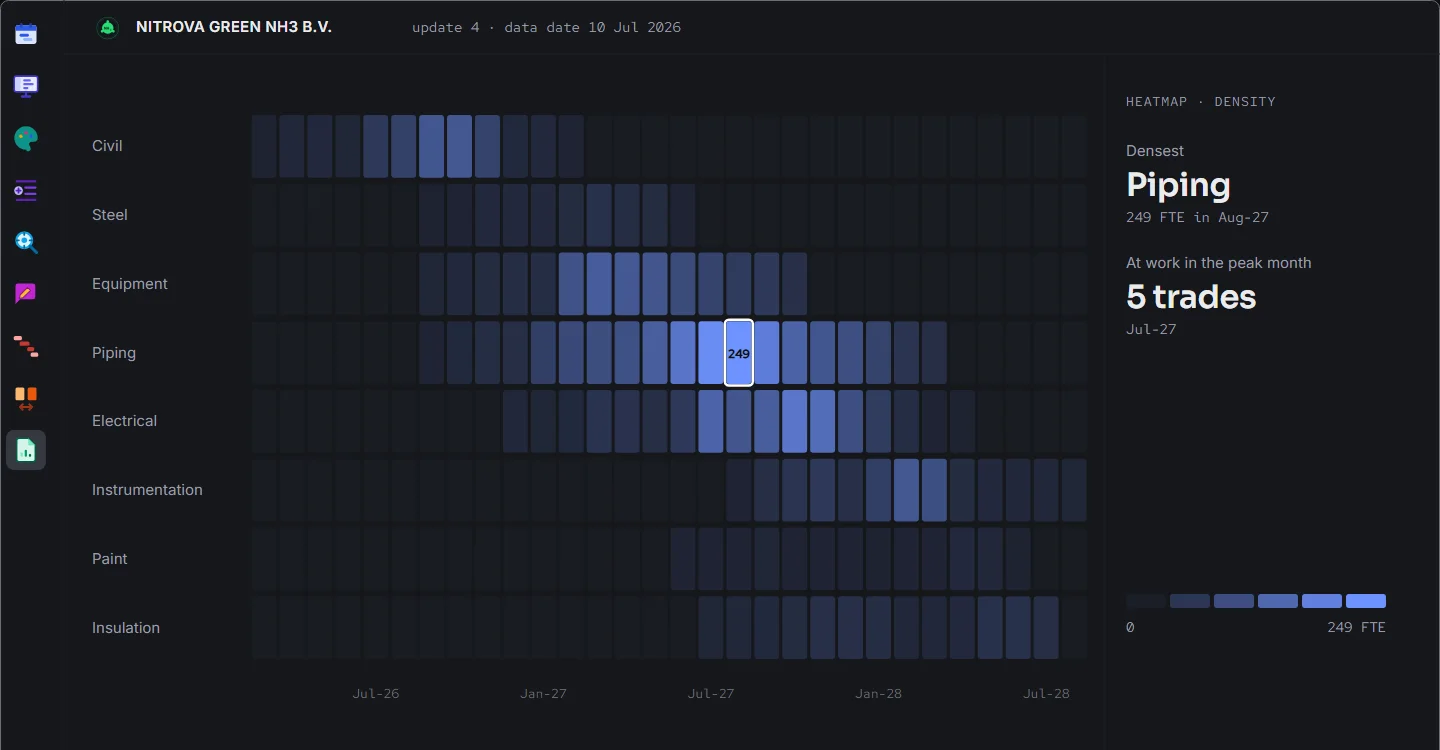
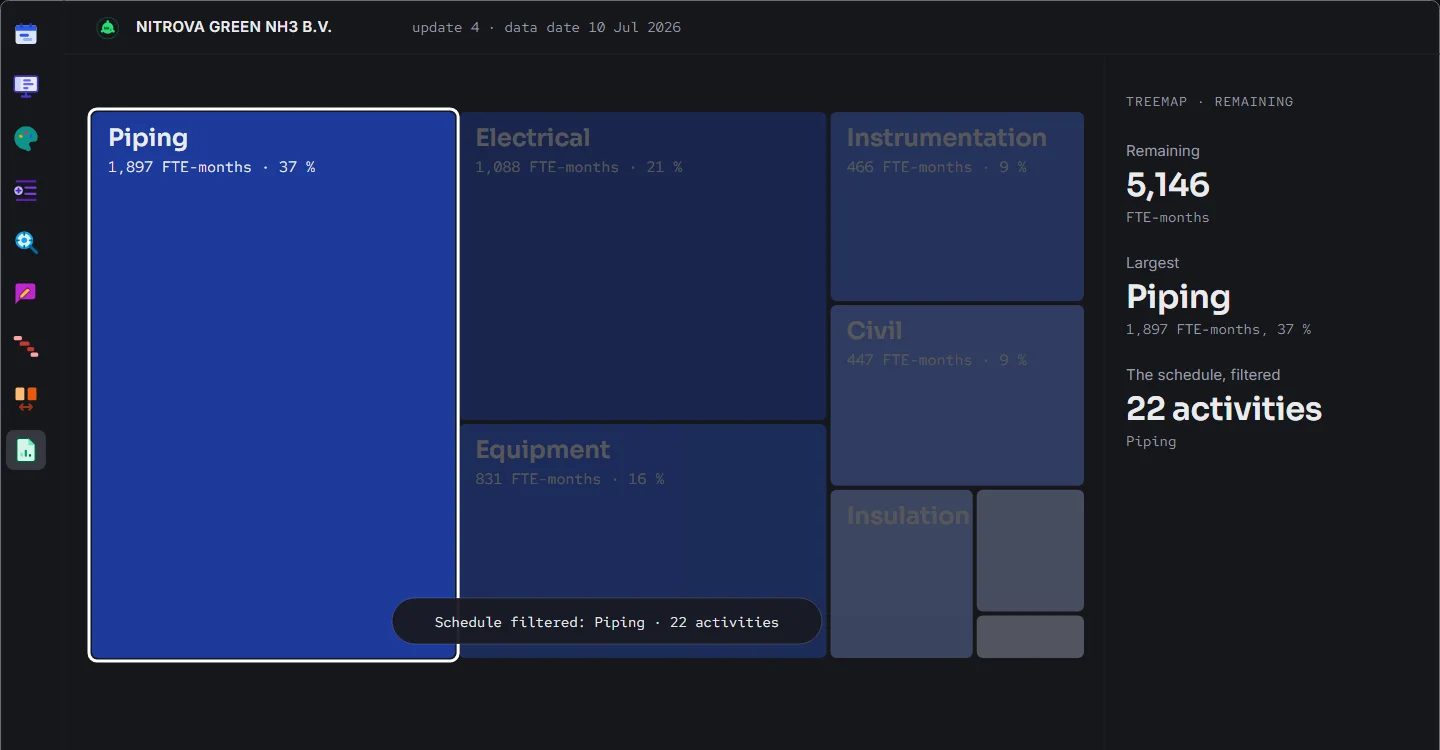
Some of the dozens of goods waiting in the app: Fogg answering in plain words, the EOT dossier, schedule comparison between two updates or all of them, customisation of almost everything, path analysis for the critical, near-critical, longest, float and driving paths, search anything, a dynamic and responsive baseline, schedule trends, live curves, seven workload charts, the resource loading under the Gantt, the automatic review of every update, health checks, density checks, a DCMA summary, the schedule report, an editable dashboard, flexible export, the portfolio dashboard, the activity diary, and more.
Release notesWhat changed, release by release
The scheduling assistant, working behind the scenes.
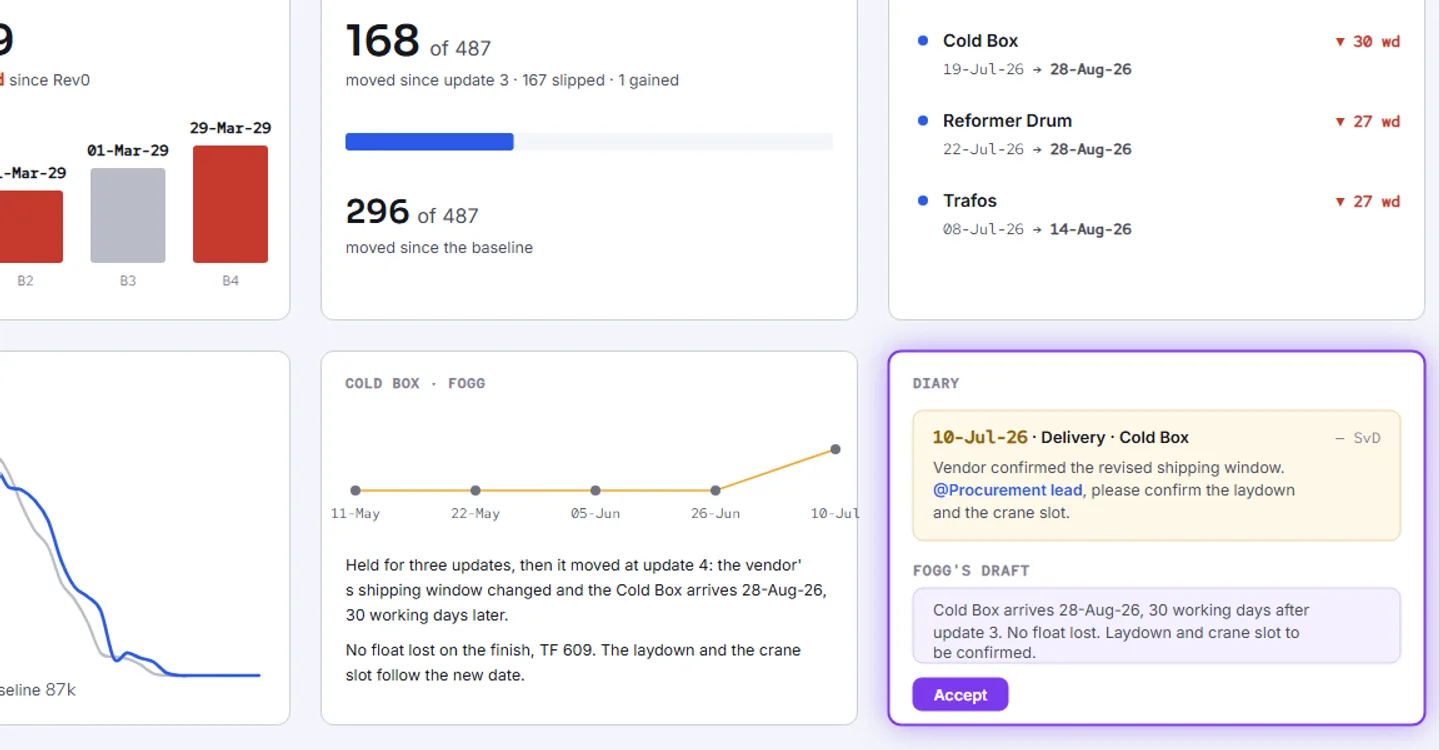
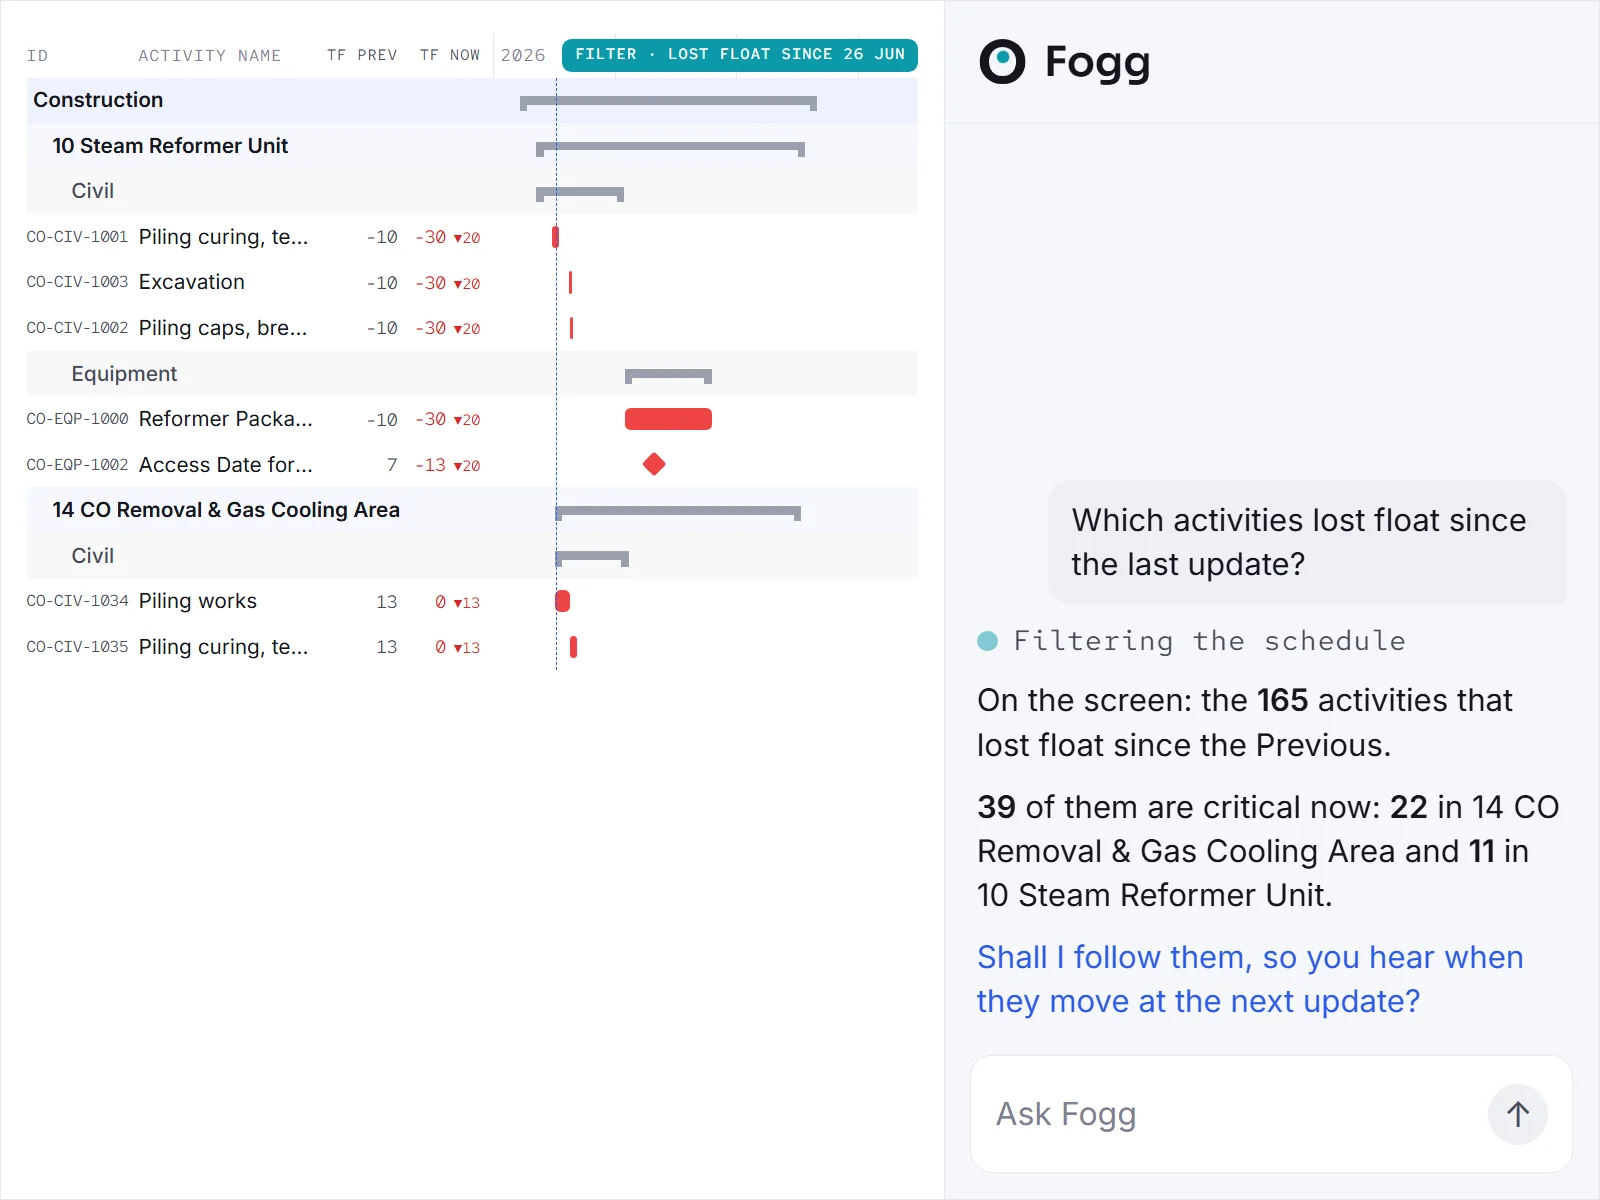
Fogg’s role in the app is the hard work, the time-consuming work. It creates the reports, it sends the portfolio manager the summary, and it keeps the story of every past slip with the version it happened in. The curves are next on its list.
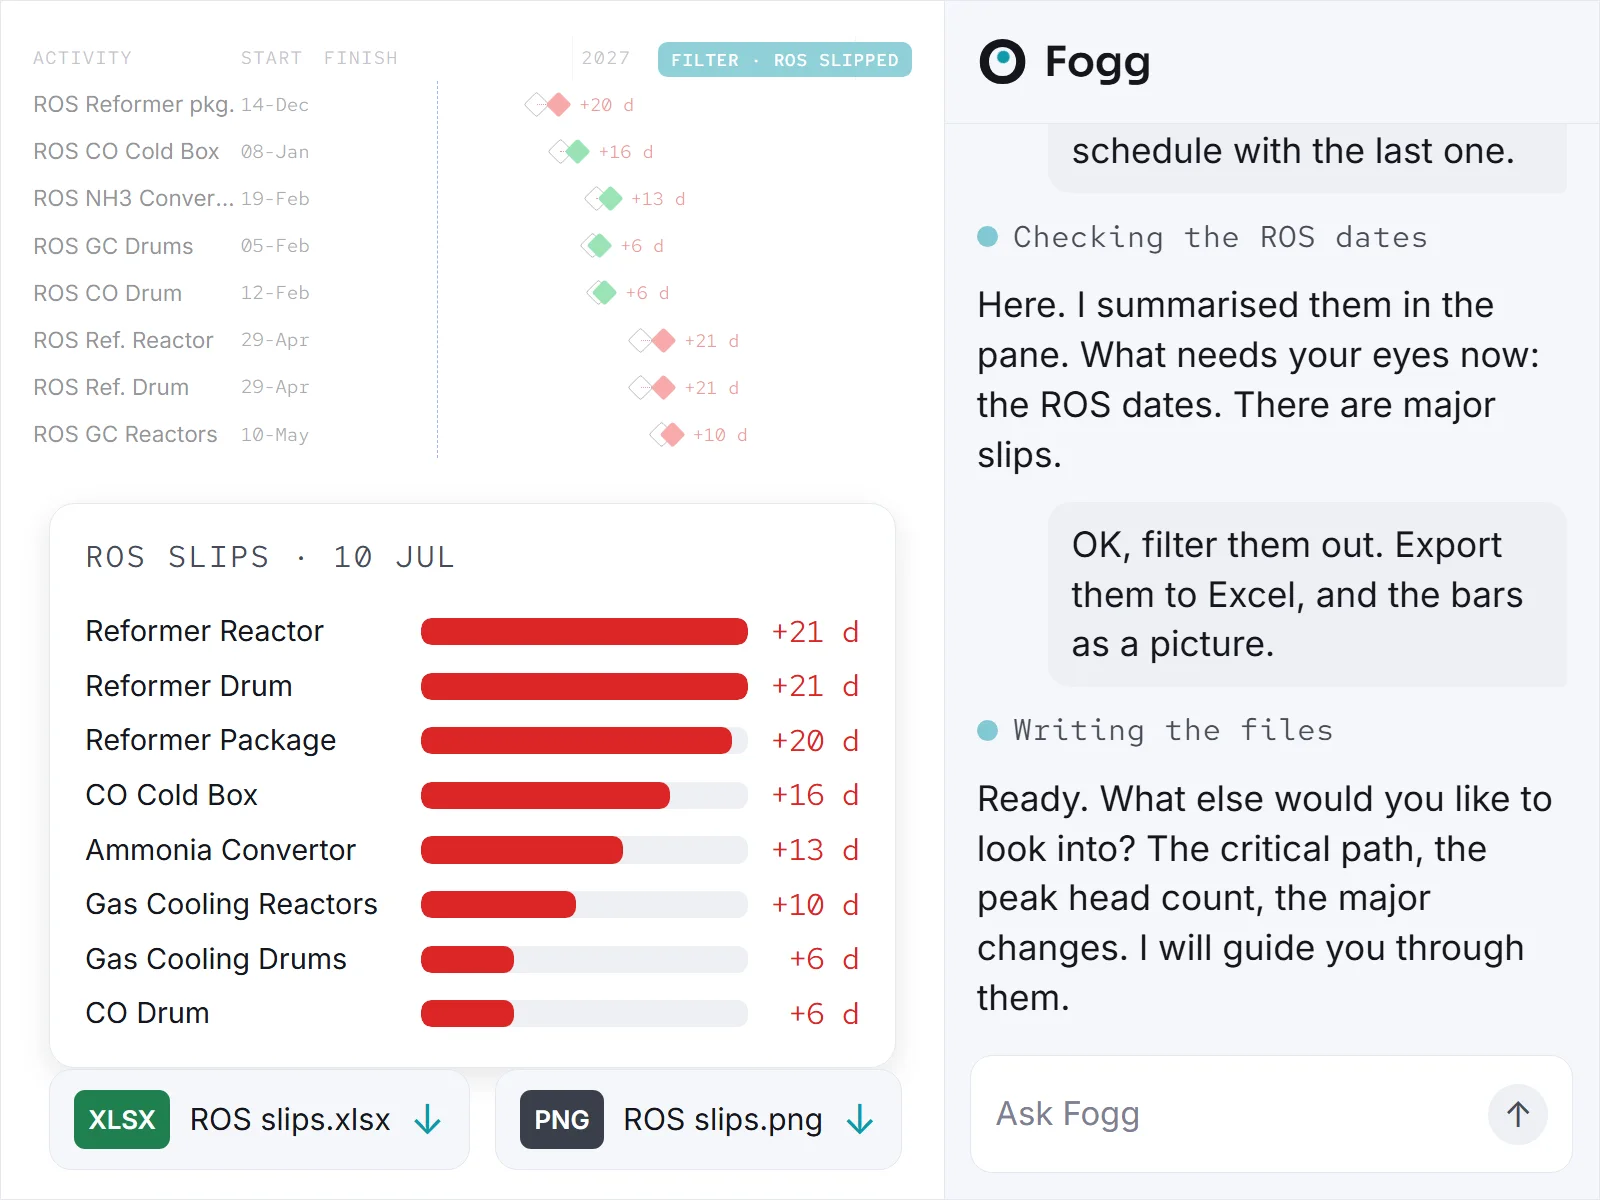
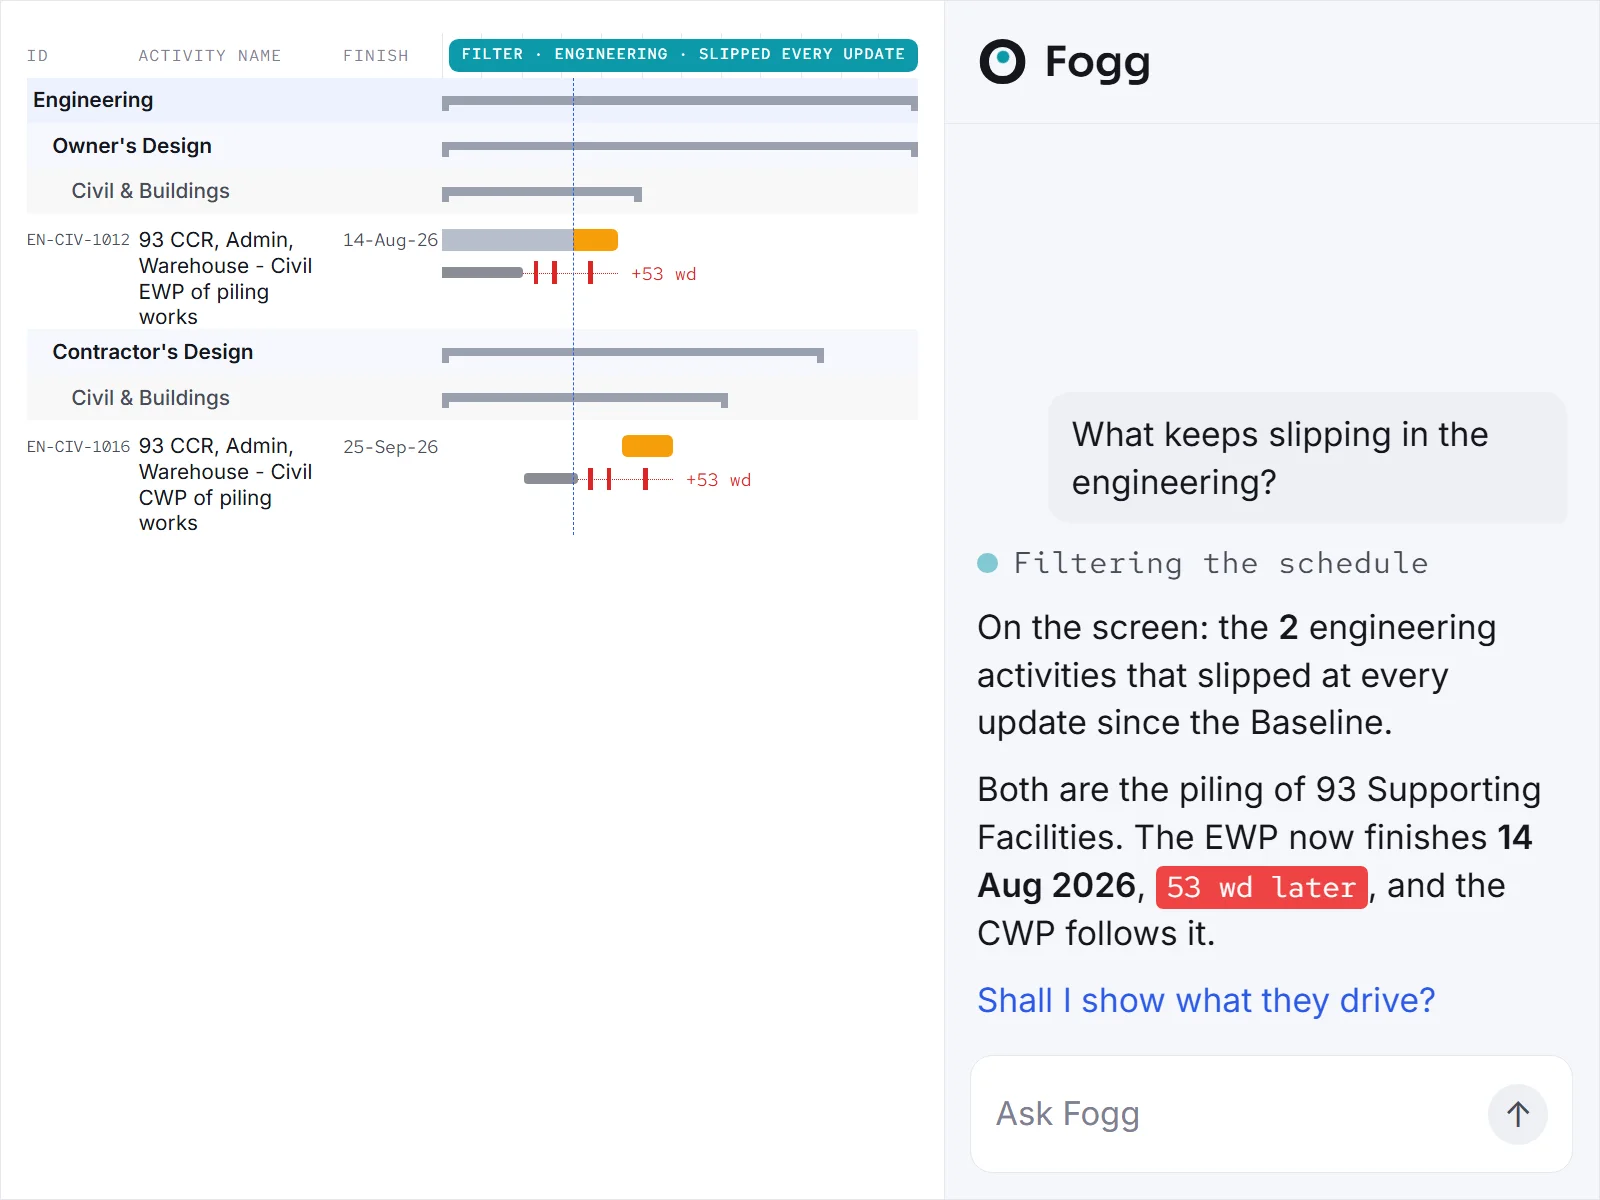
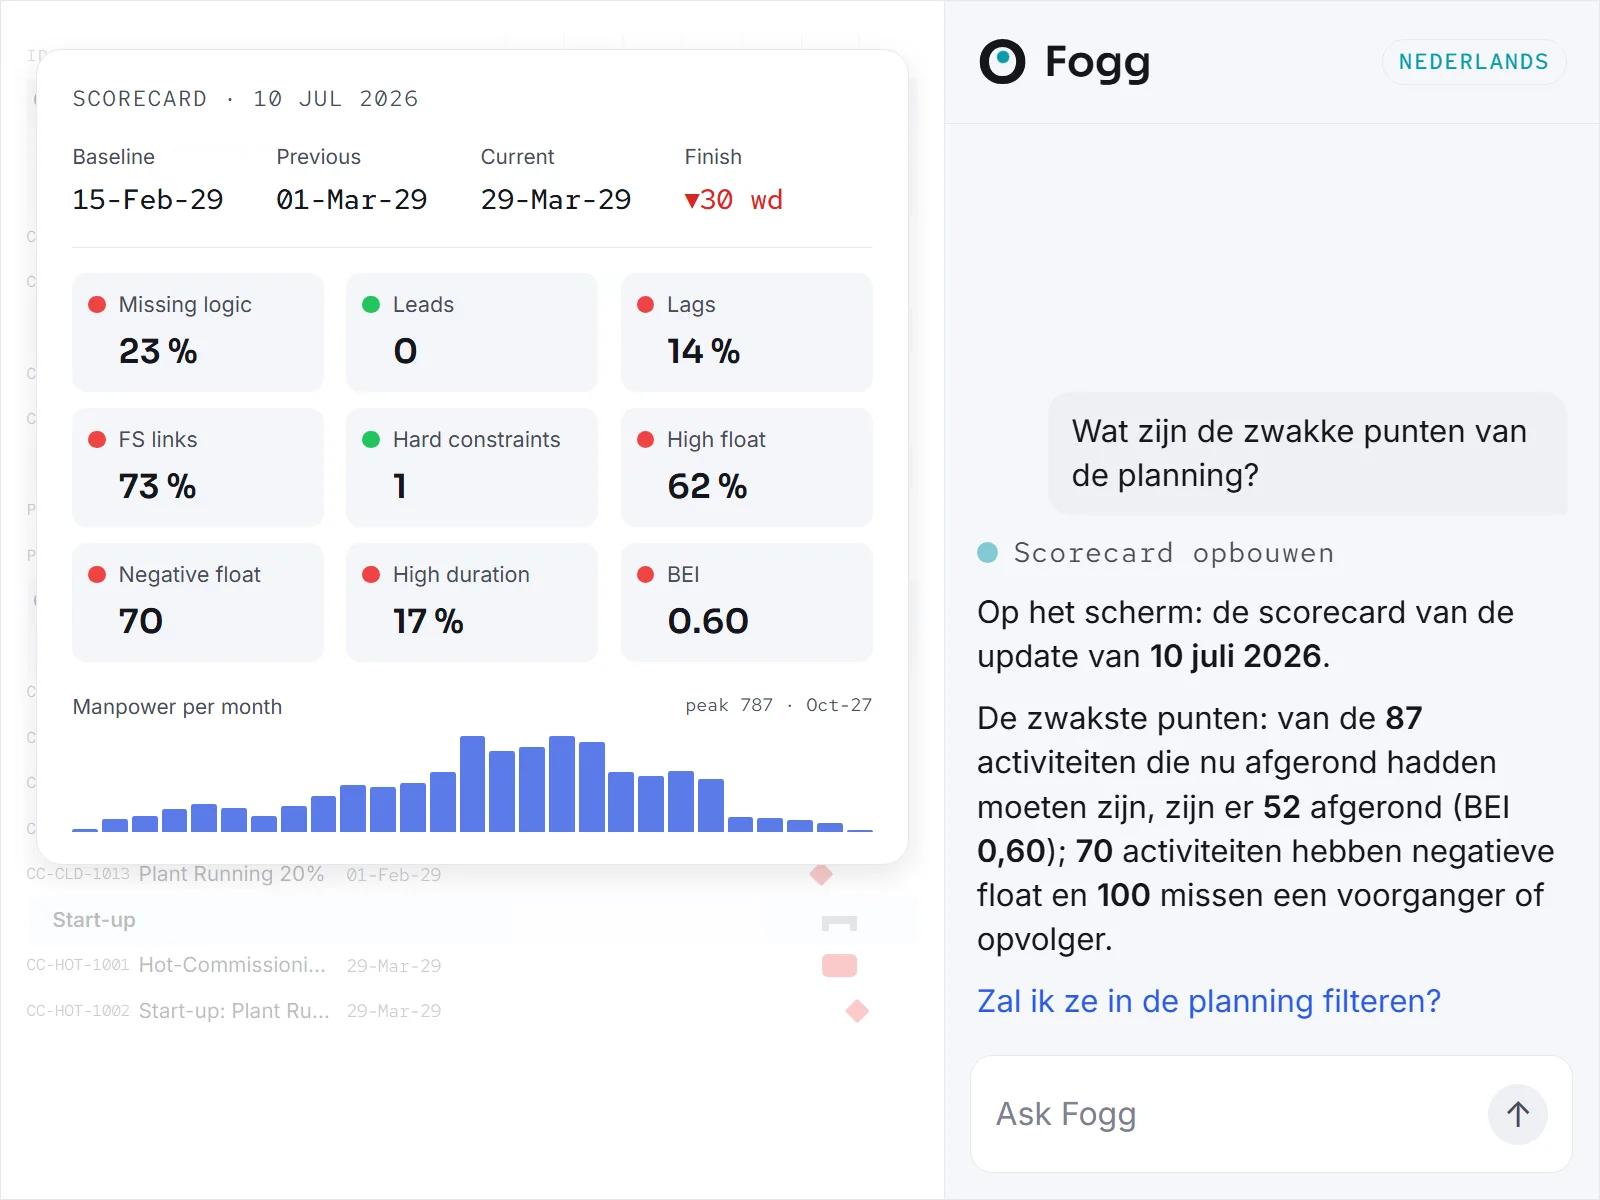
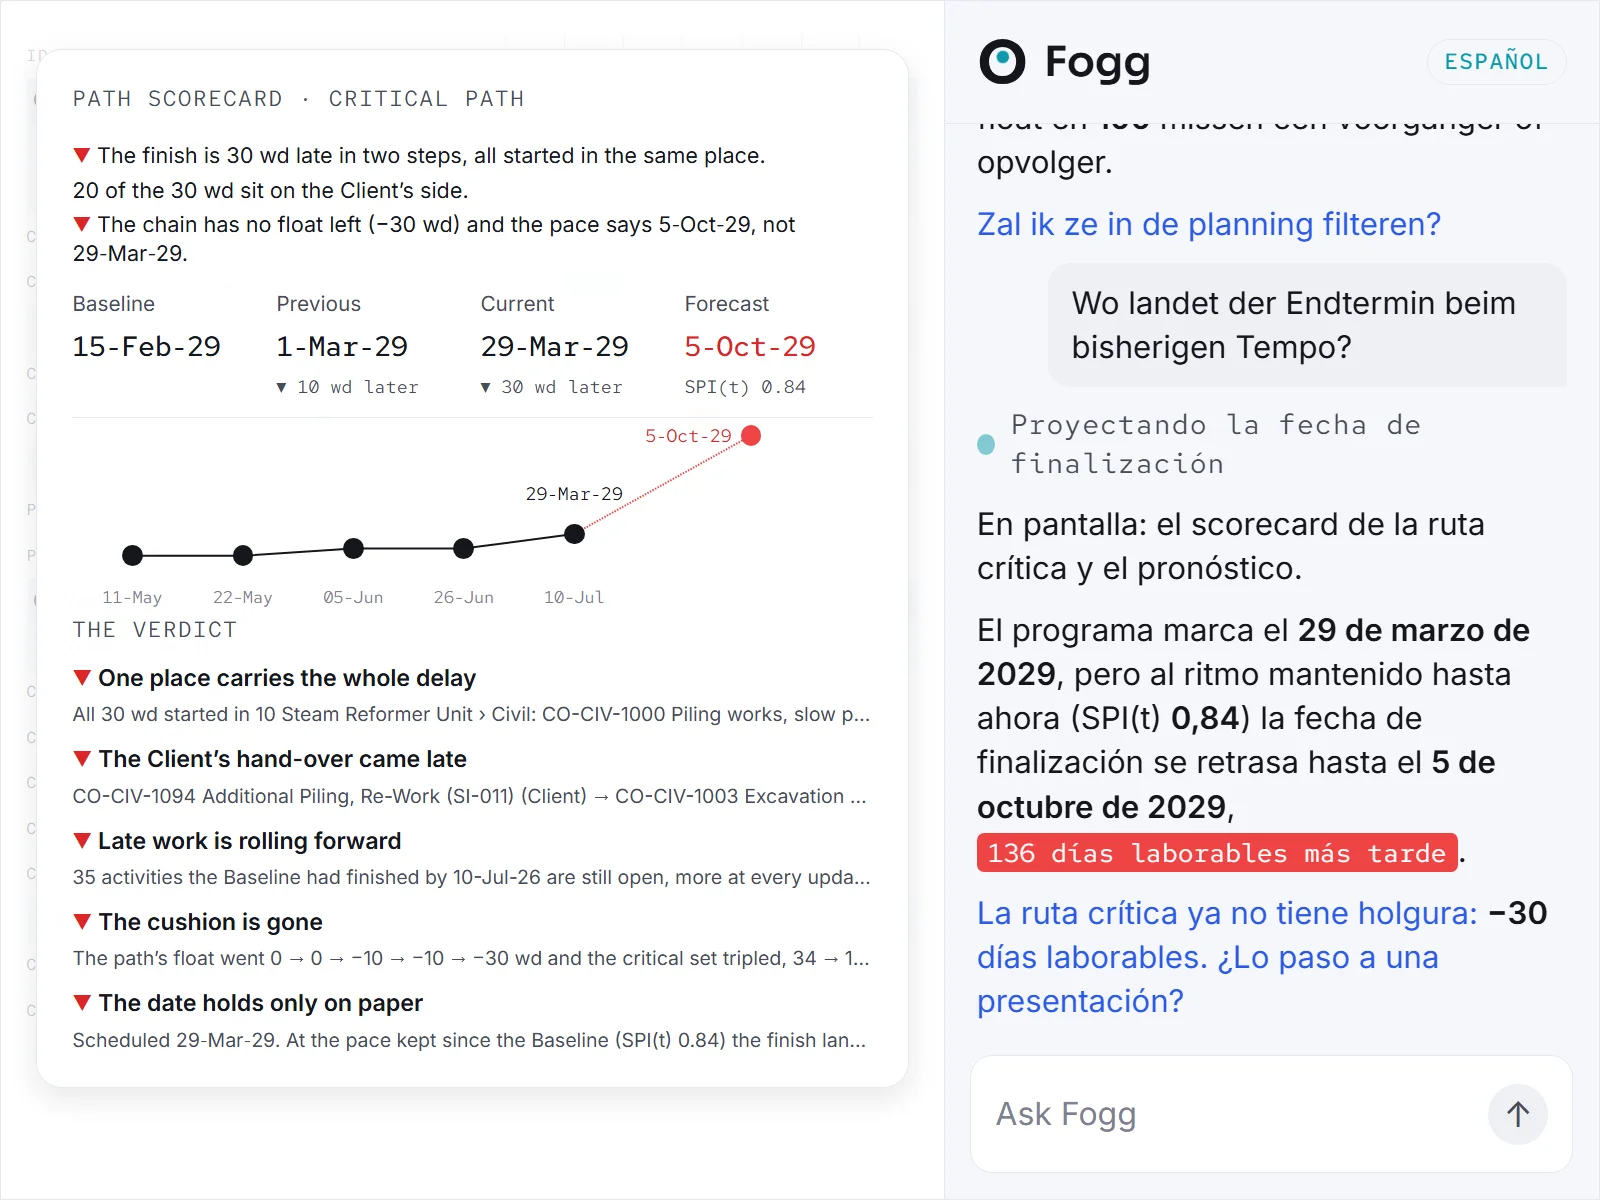
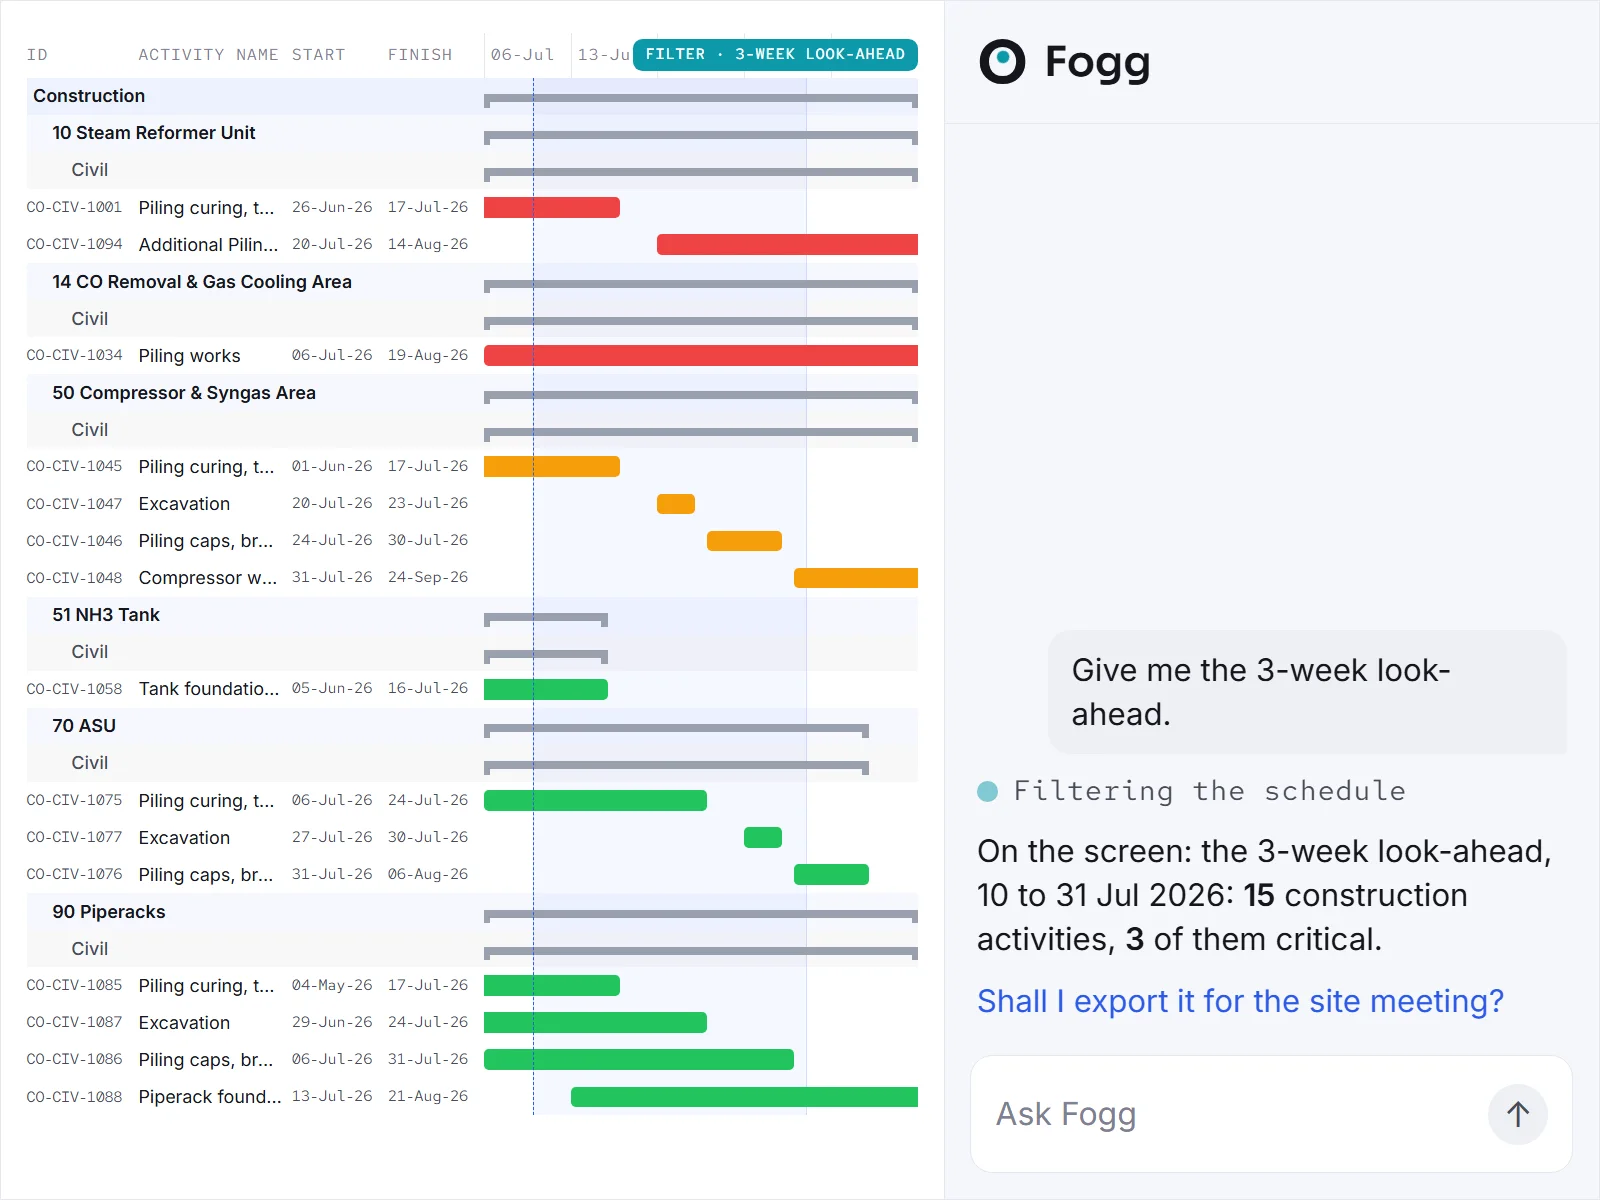
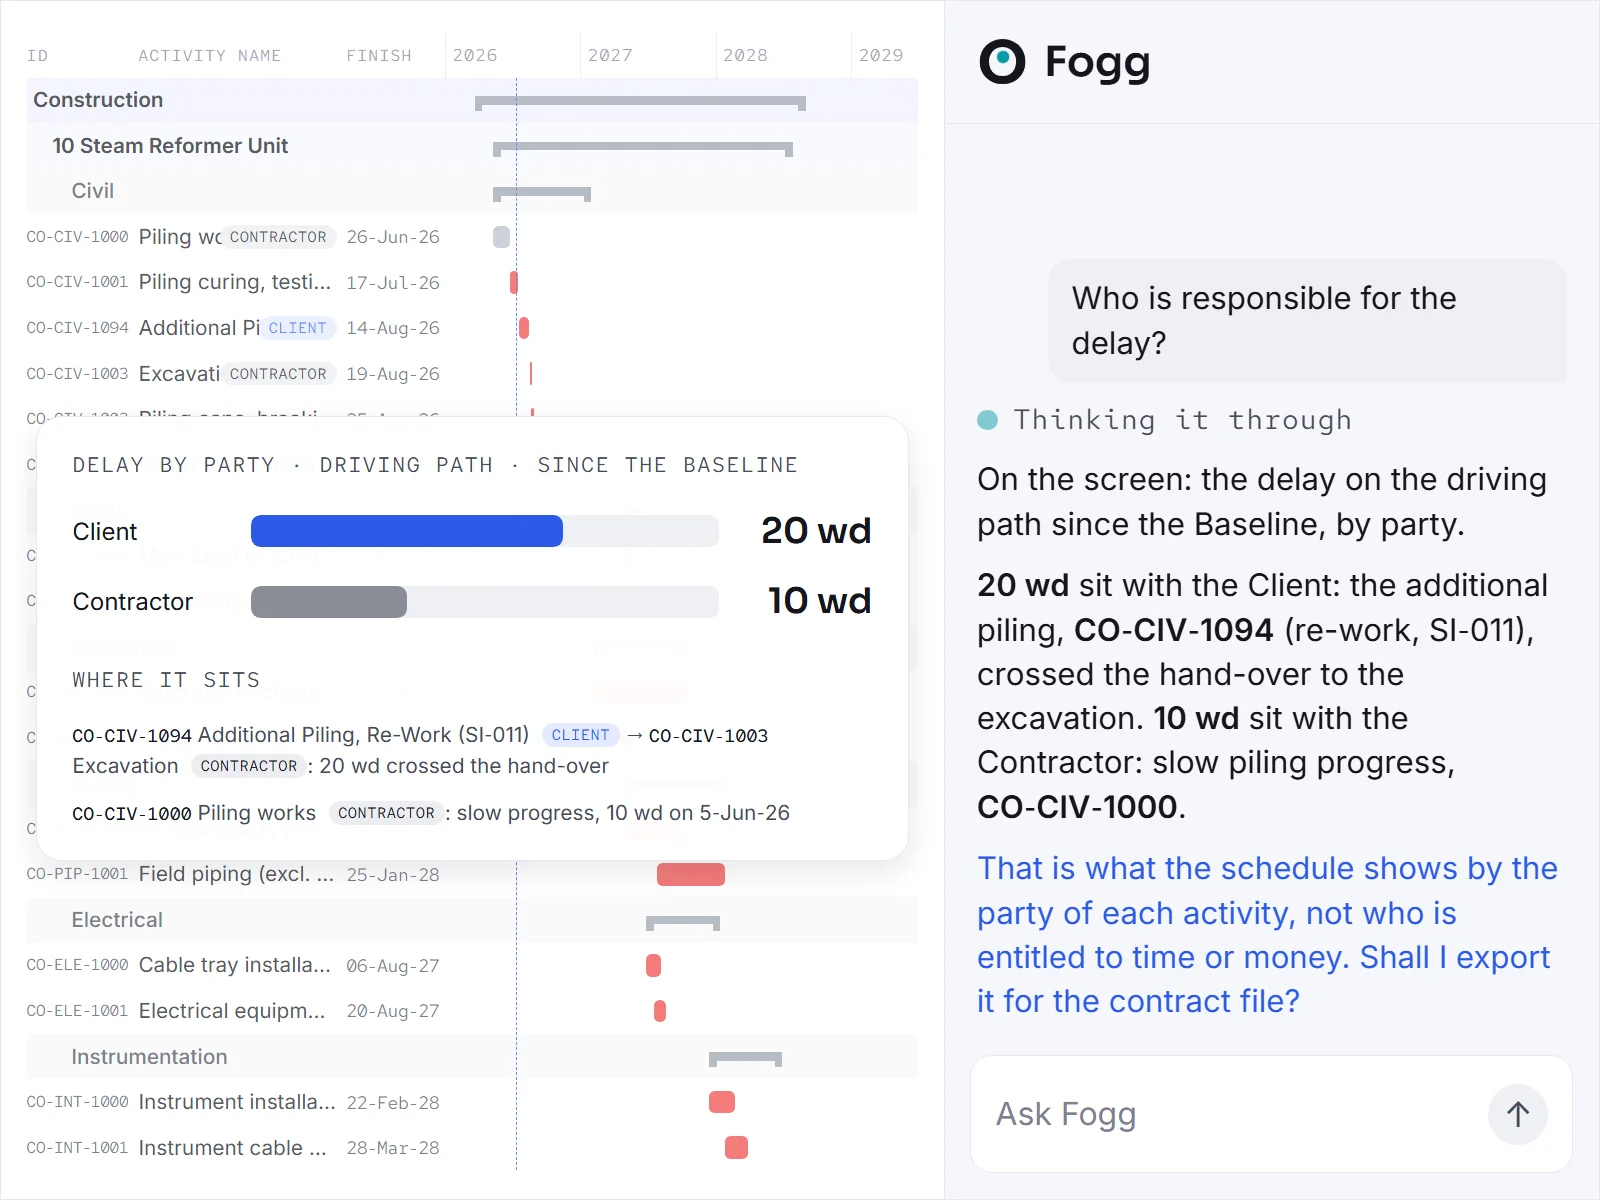
Fogg is the scheduling assistant inside the app. Ask it in plain words, and it reads the schedule, answers in a few lines and puts the answer on the screen. It works a step ahead of the team: it reads each new update as it lands and writes the brief of what moved.
It remembers. It keeps the team aware of the schedule’s events and reminds them through the inbox.
Watch Fogg at work, by role and in your language, on its own page:
Release notesWhat changed, release by release
Use casesResponsive schedules, Drivers, EOT, Advanced quality check See all →
Let us meet for the demo.
Book a demo