The schedule answers back.
Saved as “Live” or “Current”, every schedule is a snapshot. It cannot tell its own story. With ploteer, yours tells you the full story: what happened, what drove it, and where the finish is heading.
Refresh. The schedule answers back.
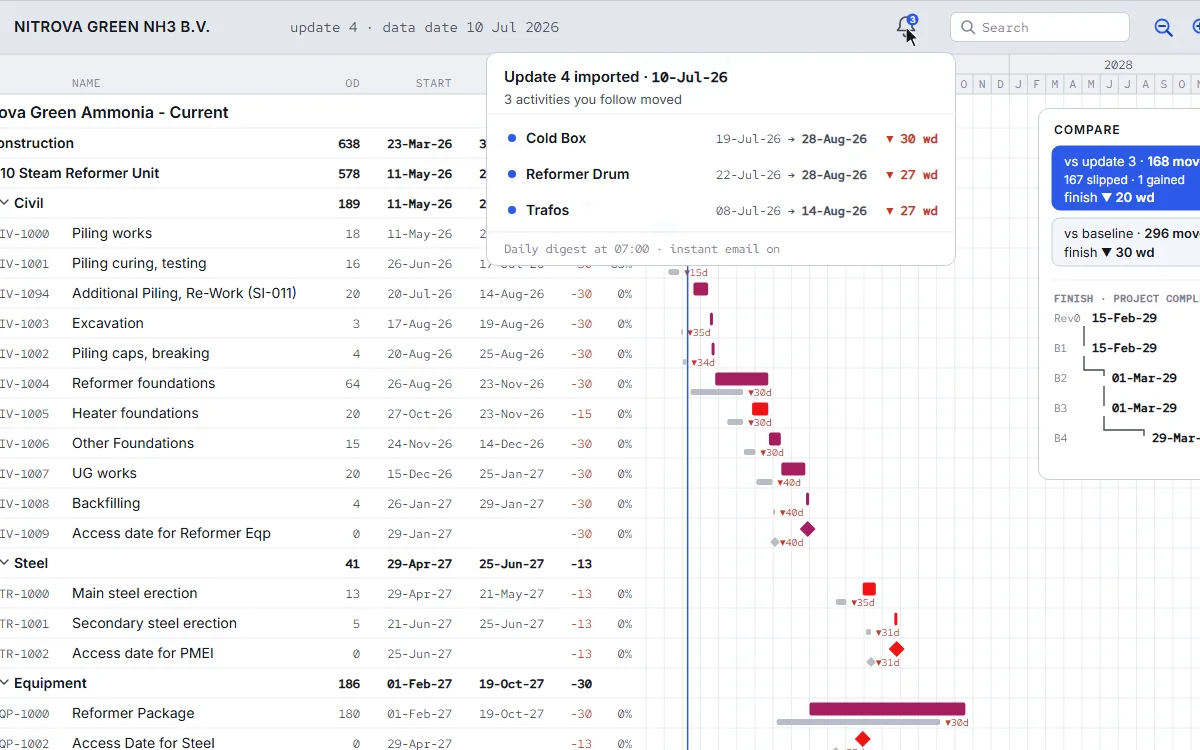
Your watch list comes to you.
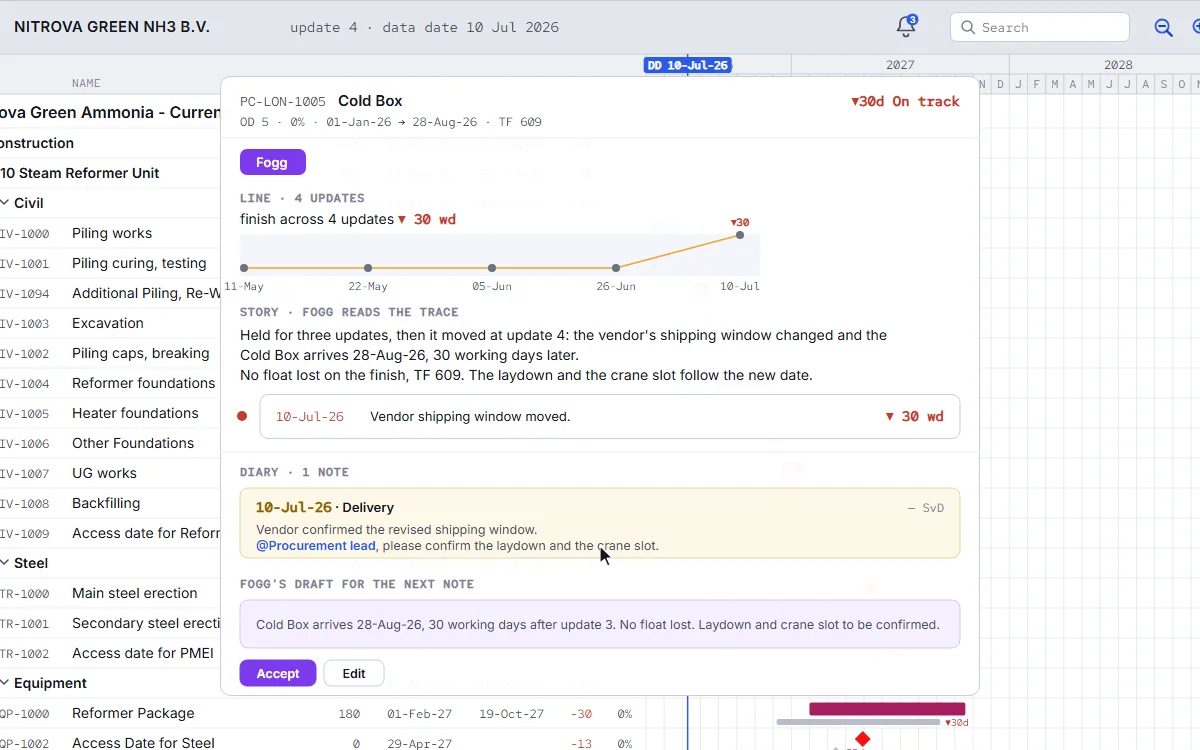
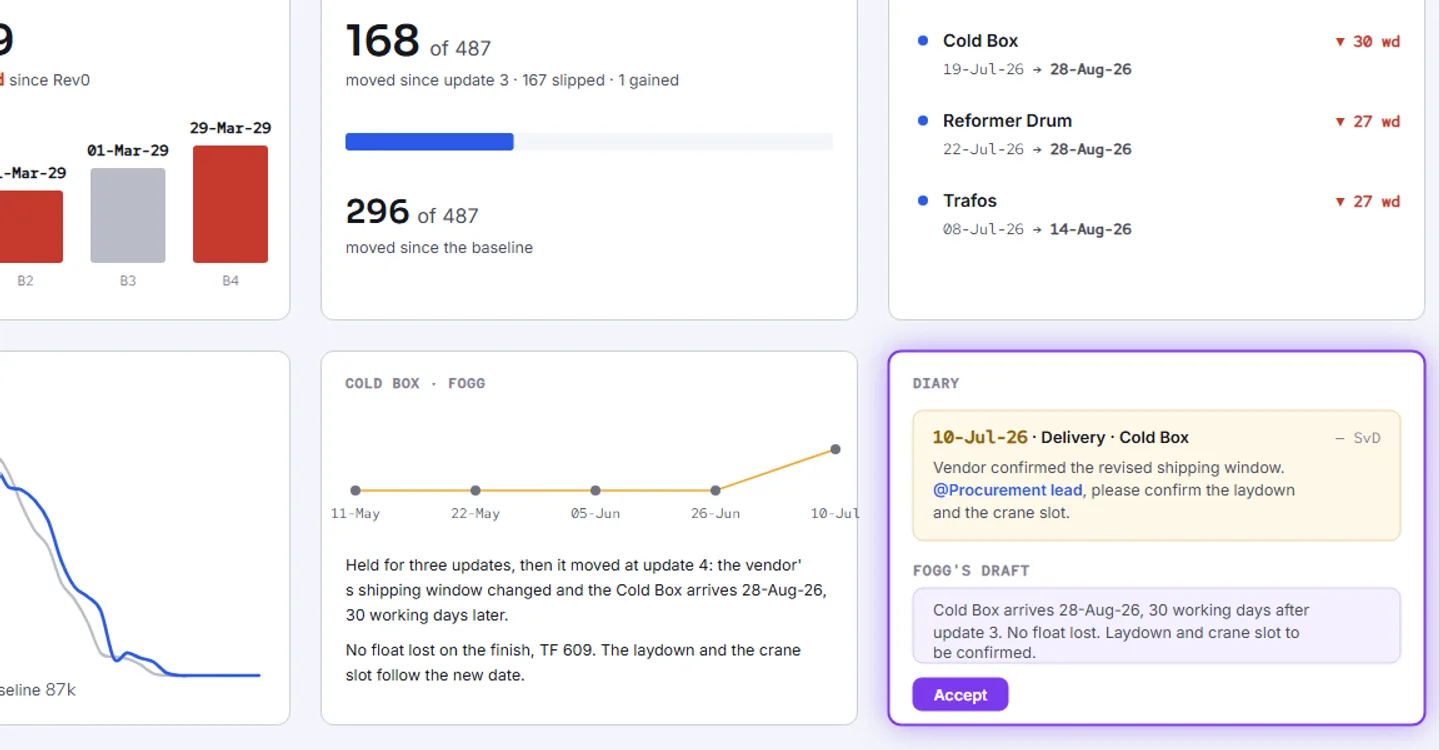
Why it moved, and who wrote it.
The peak, then and now.
Every answer on the screen, live.
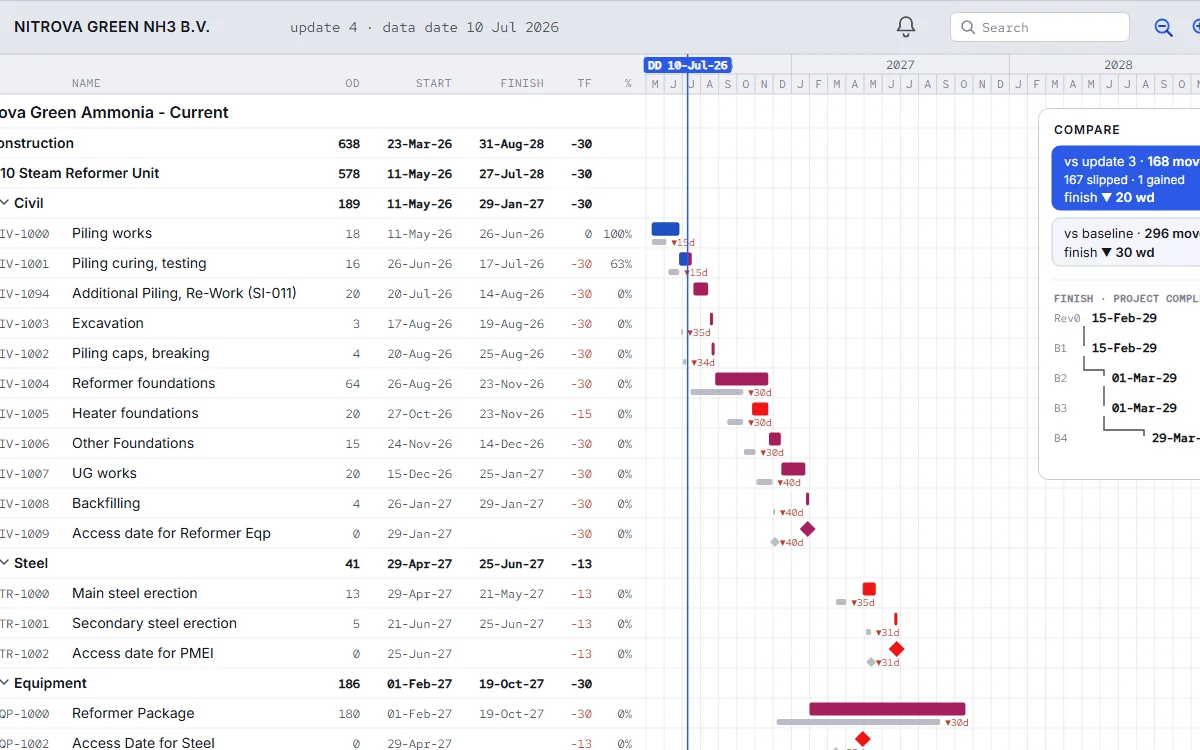
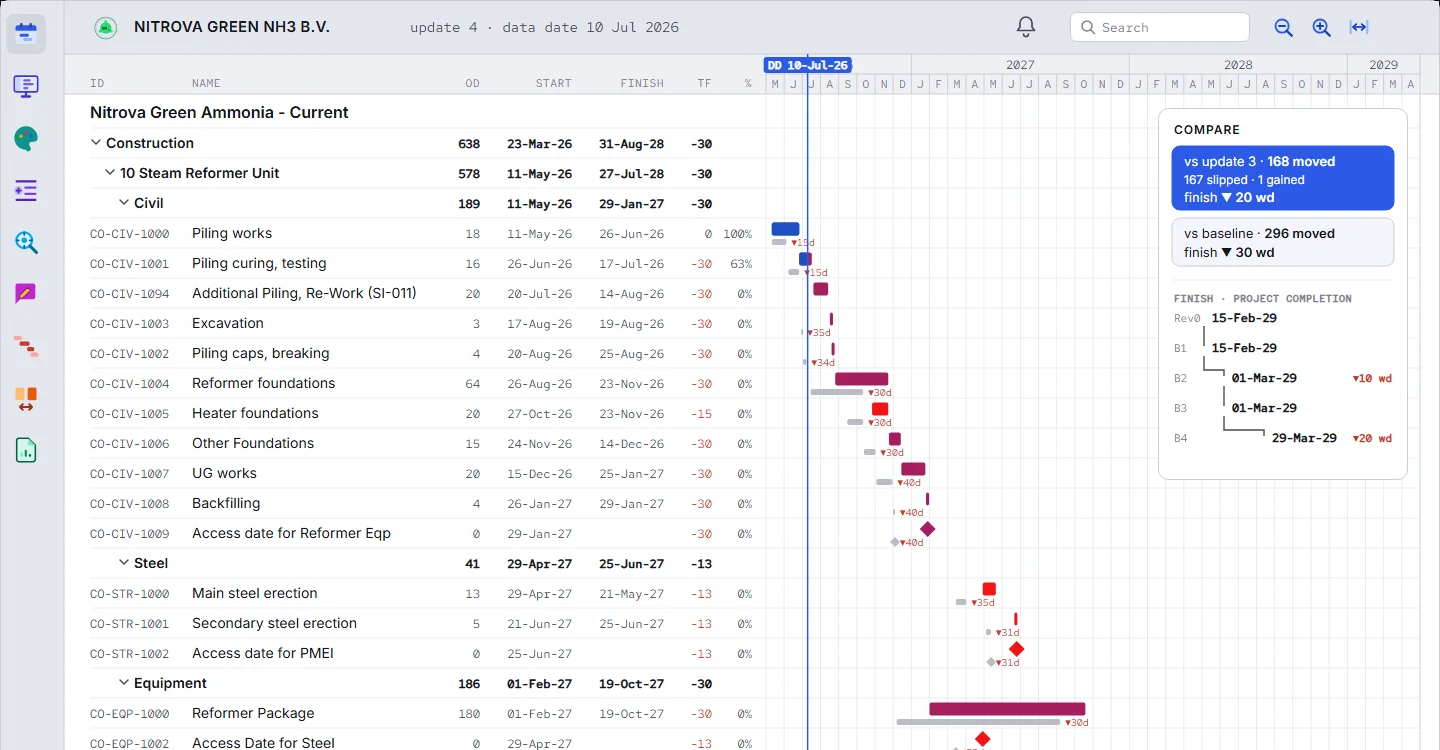
- What moved since the last update, and since the baseline?
- What is driving the finish now, and each interim milestone?
- Where was the baseline peak on the curve, and where is it now? How are the early, late and mid curves moving?
- What is on my watch list, and what moved on it?
- Why did it move, and who wrote the reason?
- Can we review it now, with every answer on the screen, live?
- 1
Refresh the update.
- 2
Let Fogg review it and compare it for you, in seconds.
- 3
Read the whole history, in your schedule's own voice, tagged to the activities.
Now your schedule has told you everything that happened, from the very first schedule to the last, all in one. Tag your team, save the notes, share them.
The story of your schedule, told by Fogg. Every update and every baseline, in one reading.
A comparison of two files tells you what changed between them. A project is not two files. ploteer keeps every update and every baseline, and Fogg reads all of them: this update against the last, this update against the baseline, and the whole line from the very first schedule to today. What moved, when it first moved, what drove it, and what the finish did each time.
The answer sits on the activity. Open one and Fogg speaks for it: the window it slipped in, the driver behind it, the reason written at the time. Short as a brief, full as a story, or with the evidence laid out. Pick the voice the room needs.
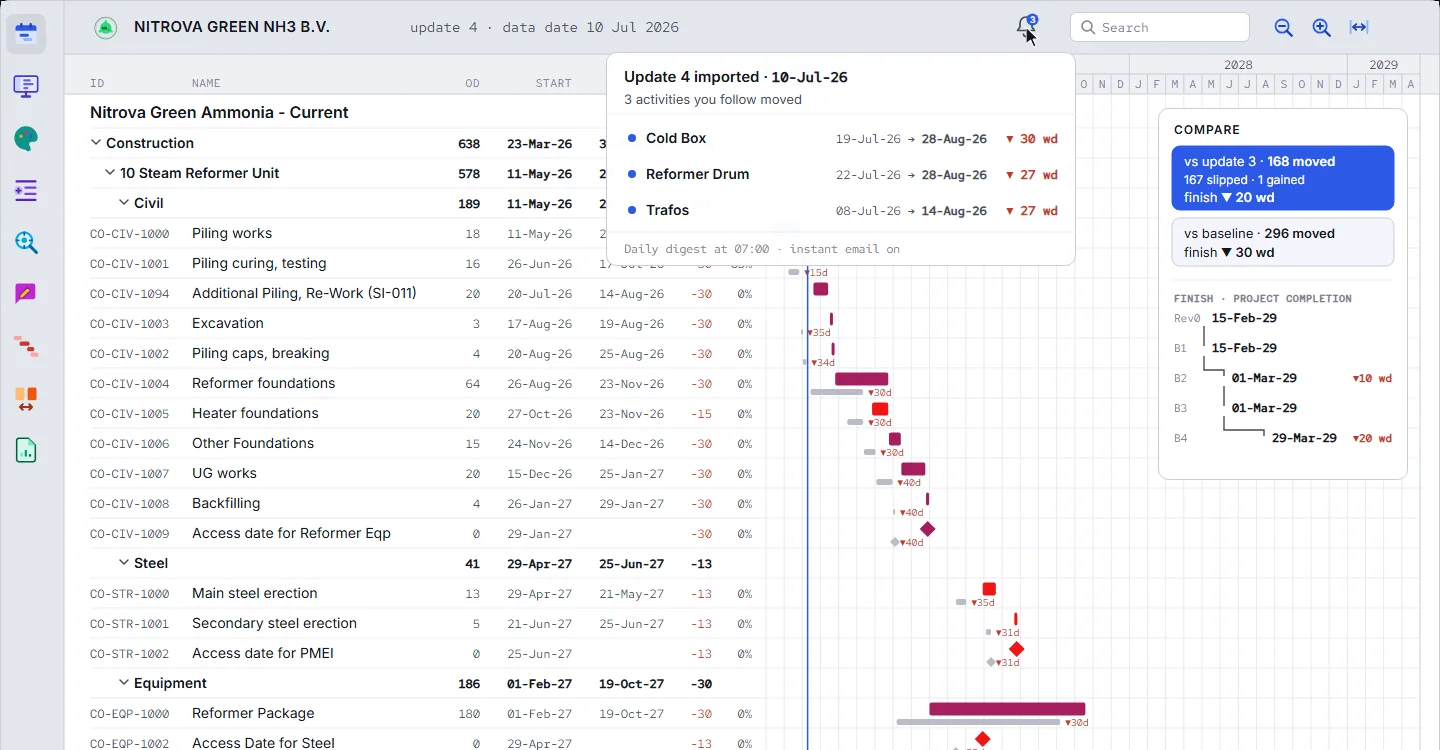
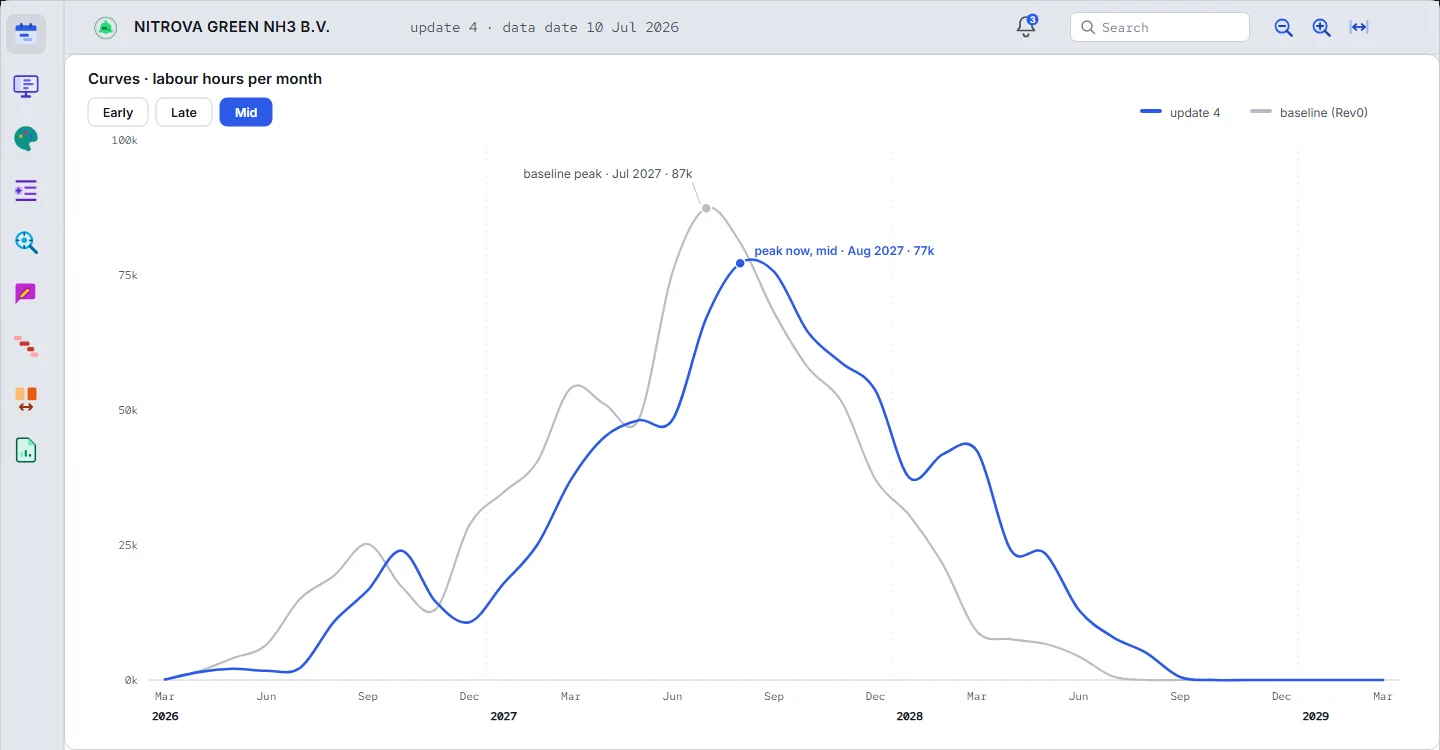
See how your curves changed, update by update, right on the screen. Key quantities, hours, FTE: pick with one click and the curve responds, live. How is the peak moving? No spreadsheet to rebuild after every update, no waiting for the answer. It is on the screen. When it has to leave the room, export it the way the reader needs it: a spreadsheet with a real chart, a PDF, a presentation or a picture.
So the six questions are answered before the meeting asks them, on the screen, live, in Schedule Dynamics. And your watch list does not wait for you to look. It comes to you: the bell, an email, the daily digest.
Then it travels. Keep the draft Fogg wrote for the Diary, or edit it. Send it as a picture in an email. Next update, refresh, and it carries on from where it stopped.
Let us meet for the demo.
Book a demoComparison, Critical Path, Curves, Diary, Notifications, Fogg