Two demo sessions with an energy owner's project team.
In October, an owner in the energy sector met ploteer twice to see Primavera P6 schedule review and Fogg, its AI scheduling assistant, at work. Planning, supply chain, contracts, portfolio and project management each brought their own questions; at the second session, Fogg answered live.
Owners in the energy sector run some of the largest and most scrutinised schedules in the industry, with contractors, vendors and partners feeding one plan. In October, the project team of one of them met ploteer twice. Across the two sessions, the planning team was joined by the supply chain manager, the contract manager, the portfolio manager and the project manager.
1 October: the schedule, seen and understood
The first session walked through the demo project, Holland 200K Green NH3. Smart Boards put the schedule on the plant’s plot plan, zone by zone, so the room saw progress and the critical path where the work happens. Schedule Dynamics then read every update against the one before it: what moved, where the delay started, and where the finish is heading.
29 October: a wider room, and Fogg live
Four weeks later, a second session followed with a wider room, together with some of the owner’s partners. Fogg answered the room’s questions live in the app, on the same demo project, in plain words, with the activities on the screen.
The question each role brings, and what ploteer answers
- The planning team: what changed since the last update? Every update is reviewed the moment it is imported: what moved, where the delay starts, the findings in a planner’s words, and the project on one slide.
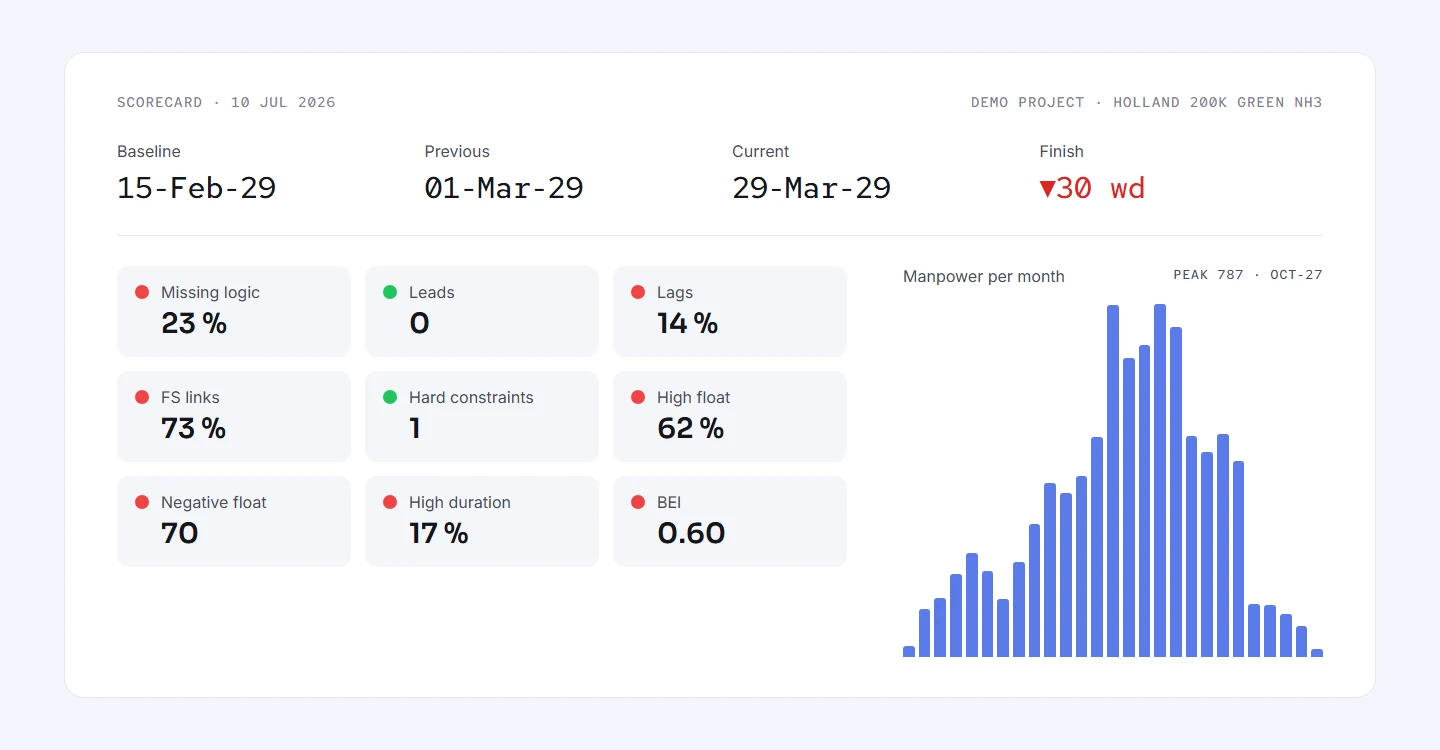
- The project manager: what drives the finish, and where is it heading? The driving path to the finish, where the delay started, and the forecast at the pace the critical path has kept since the Baseline. On the demo project, at that pace (SPI(t) 0.84), the finish scheduled for 29 March 2029 is forecast for 5 October 2029.
- The supply chain manager: are deliveries holding their required-on-site dates? The ROS milestones in the schedule that moved since the last update, ranked by how far, ready to go out as a sheet or a picture. On the demo project, eight slipped in one update.
- The contract manager: where does the delay sit, by party? The delay on the driving path split by the party that owns each activity, as the schedule shows it: on the demo project, 20 working days on Client activities and 10 on Contractor activities. Who is entitled to time or money stays with the contract team. Comments sit on their activities, and one marked as an event keeps the date it happened: part of the record a claim, or its review, draws on. Extension of time tells the whole story.
- The portfolio manager: which projects need attention? Every project’s current finish against its Baseline, in working days of its own calendar, with a delayed or on-plan mark, and a daily email digest of what each manager follows.
Questions from both sessions
Three questions came up in both sessions. Can many schedules be read together? Side by side, yes: the portfolio, and schedules in stacked panes, each on its own timescale, as Many schedules shows; joining them into one programme is where ploteer is heading. Can we see the effect of a change before it is made? That is where ploteer’s own scheduling engine is heading; today the effect of every change is read the moment the update lands. Where does the app run? In the browser, with one database per client, reached through the client’s own link; Fogg is switched on per client.
What comes next
The questions from both sessions go into what ploteer builds next. More demo sessions, with other teams, are planned for November.
Let us meet for the demo.
Book a demo